Types of injury
In 2020-21, for all injuries, fractures were the most common type of injury overall followed by open wounds and soft tissue injuries (AIHW 2023b).
In 2020-21, where spinal injuries were the principal diagnosis, fractures were reported in around:
- 3 in 5 spinal injury ED presentations (58% or 11,317 cases)
- 4 in 5 spinal injury hospitalisations (83% or 15,920 cases).
Fractures were the leading type of spinal injury for ED presentations
Following fracture, soft tissue injury was the leading type of injury for spinal injury ED presentations (58% or 11,317 cases, and 38% or 7,337 cases, respectively).
ED presentations were similar for males and females for injury type.
In 2020–21:
- Just under half of ED presentations for spinal injuries were triaged as Urgent (45%).
- Nearly a third of cases had a waiting time over one hour (31%).
- Almost a quarter (24%) of ED presentations for spinal injuries were attended to in under 10 minutes.
Table 4: Top 3 specified types of spinal injury, 2020–21
Spinal injury ED presentations | % | All injury ED presentations | % | Spinal injury hospitalisations | % | All injury hospitalisations | % |
|---|---|---|---|---|---|---|---|
Fracture | 58 | Fracture | 22 | Fracture | 83 | Fracture | 38 |
Soft-tissue | 38 | Open wound | 17 | Soft-tissue | 10 | Open wound | 16 |
Nerve | 3 | Soft-tissue | 15 | Nerve | 5 | Soft-tissue | 10 |
Source: AIHW National Hospitals Morbidity Database and AIHW National Non-admitted Patient Emergency Department Care (NNAPEDC) Database
Injury types for spinal injury hospitalisations were similar for males and females
For hospitalisations with a principal diagnosis of spinal injury, the distribution of injury types did not vary much between males and females, although:
- Males had a slightly higher proportion of nerve injuries than females (5% or 653 and 2% or 277 respectively).
- Females had a slightly higher proportion of fracture injuries than males (81% or 10,045, and 74% or 10,515 respectively).
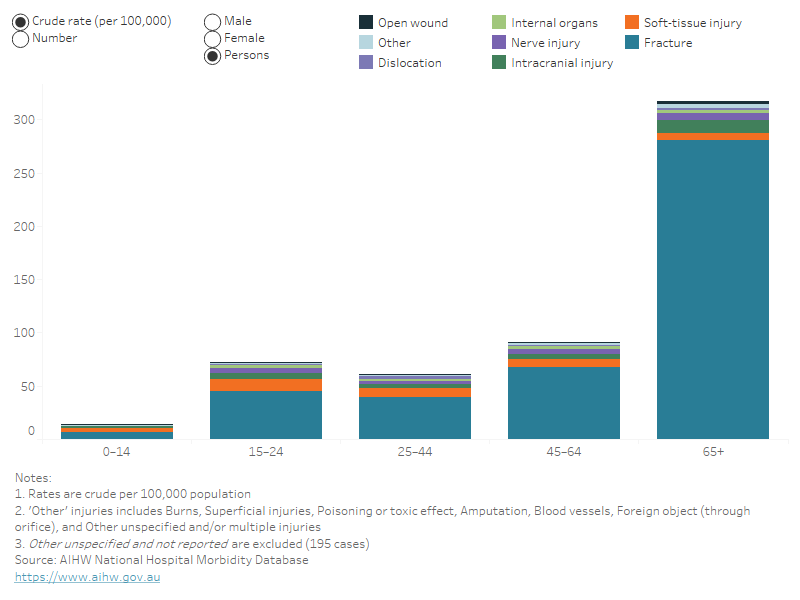
People 65 years and older had the highest rates of spinal injury hospitalisation across most injury types
Rates of principal diagnosis spinal injury hospitalisations were highest among people aged 65 years and over across all injury types, with a few notable exceptions:
- The 15–24 age group had the highest rates of soft tissue injury (11.7 per 100,000, respectively).
- The 25–44 age group had the highest rates of dislocation injuries (2.2 per 100,000 respectively).
- The 25–44 and 45–64 age groups had the highest rates of blood vessels injuries (0.4 per 100,000).
Figure 6: Number and rate of hospitalisations for spinal injuries, by injury type and age group, 2020–21
A stacked bar chart showing that the 65 and over age group had the highest rates of spinal injury hospitalisations for fracture, intracranial, open wound, nerve and other injuries.

References
AIHW (2023) Injury in Australia, AIHW, Australian Government, accessed 25 August 2023.


