Excessive alcohol consumption
Regular consumption of alcohol at high levels increases the risk of alcohol-related harm. High intakes can contribute to the development of chronic diseases such as liver disease, some cancers, oral health problems and cardiovascular disease. Alcohol consumption can also play a part in excess energy intake, contributing to excess body weight. Reducing alcohol consumption reduces the risk of developing these conditions and other health problems [1].
A number of nationally representative data sources are available to analyse recent trends in alcohol consumption. The Australian Institute of Health and Welfare (AIHW) National Drug Strategy Household Survey (NDSHS) and the Australian Bureau of Statistics (ABS) National Health Survey (NHS) have both collected data on alcohol consumption from people aged 18 or over for a number of years. The NHS also collected data from people aged 15–17 from 2007–08 and the NDSHS also collected data from people aged 14–17 from 1985 and from people aged 12–13 from 2004.
Comparisons of data from the NDSHS and NHS show variations in estimates for alcohol consumption. For more information on the technical details of these two surveys, see technical notes. In this section, total population prevalence estimates and trends are presented for both the NHS and NDSHS, however the remainder of the results by age and population groups are derived from the NHS.
Box 1: How is risk of alcohol-related harm measured?
Alcohol consumption refers to the consumption of drinks containing ethanol, commonly referred to as alcohol. The quantity, frequency or regularity with which alcohol is drunk provides a measure of the level of alcohol consumption.
NHMRC guidelines for alcohol consumption provide advice on reducing the risks to health from drinking alcohol. For healthy men and women, drinking no more than 2 standard drinks on any day reduces the lifetime risk of harm from alcohol-related disease or injury. Drinking no more than 4 standard drinks on a single occasion reduces the risk of alcohol-related injury arising from that occasion.
Alcohol-related risk is defined as follows:
- lifetime risk for alcohol consumption of more than 2 standard drinks per day
- single occasion risk for alcohol consumption of more than 4 standard drinks at a single occasion.
Note that one standard drink contains 10g of alcohol (12.5 mL of pure alcohol) [1].
In the Australian Bureau of Statistics (ABS) 2014–15 National Health Survey (NHS), alcohol risk was derived from an individual's average daily consumption over the 3 most recent days that they had consumed alcohol in the week before the interview [2,3].
In the AIHW National Drug Strategy Household Survey (NDSHS), a number of questions are used to calculate lifetime risk including: how many drinks they usually have per occasion and how often they drink (quantity-frequency method); and how often they drink different quantities of alcohol over a 12 month period (graduated quantity-frequency method).
Results presented here relate to lifetime risk of alcohol-related harm or injury as defined above.
Who exceeds the lifetime alcohol risk guidelines?
Based on self-reported data from the ABS 2014–15 NHS, almost 1 in 5 people aged 18 and over (17%) consumed more than 2 standard drinks per day on average, exceeding the lifetime alcohol risk guidelines. Overall, men were 3 times as likely to be at lifetime risk of harm due to alcohol as women (26% and 9.3%, respectively).
Based on self-reported data from the AIHW 2016 NDSHS, a similar proportion, almost 1 in 5 (18%) people aged 18 or older, consumed more than 2 standard drinks per day on average, exceeding the lifetime risk guidelines [4].
After adjusting for differences in the age structure of the population over time, both surveys showed a decline in the rate of lifetime risky alcohol consumption among adults over a similar period.
- For the NHS lifetime risky alcohol consumption decreased from 21% in 2007–08 to 17% in 2014–15.
- For the NDSHS lifetime risky alcohol consumption decreased from 22% in 2007 to 18% in 2016.
Risky alcohol consumption by age and sex
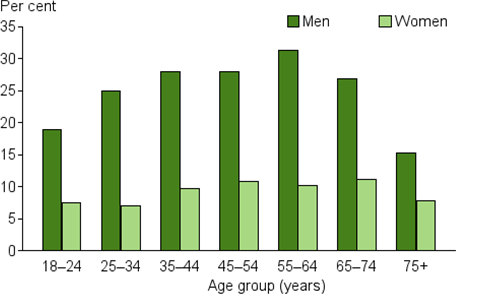
Around one-quarter (26%) of men aged between 18 and 64 exceeded the lifetime alcohol risk guidelines, although rates were lower in the 18–24 year age group. (Figure 1). Among older men the proportion fell sharply, with 15% of those aged 75 and over exceeding recommended levels. Men in the 55–64 year age group were most likely to exceed lifetime alcohol risk guidelines (31%).
For women there was a similar trend across age groups but at lower levels of intake. Women in the 65–74 year age group had the highest rate of exceeding the lifetime alcohol risk guidelines at 11%, slightly decreasing to 7.9% of women aged 75 and over.
Figure 1: Exceedance of lifetime alcohol risk guidelines in persons aged 18 and over, by sex, 2014–15

Source: ABS 2015. National Health Survey: First Results, 2014–15. ABS cat. no. 4364.0.55.001. Canberra: Australian Bureau of Statistics (see source data).
Trends in alcohol consumption
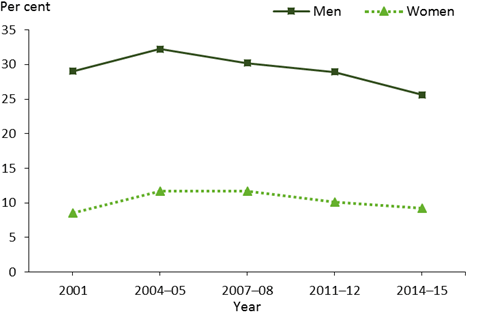
The proportion of adults at lifetime risk of harm due to excessive alcohol consumption increased between 2001 and 2004–05 but has decreased slightly since then (age-standardised; Figure 2). Between 2001 and 2004–05, the proportion exceeding lifetime alcohol consumption guidelines increased from 29% to 32% for men and from 8.5% to 12% for women. From 2004–05 to 2014–15, the proportion declined in men (from 32% to 26%) but has remained similar for women (from 12% to 9.2%).
Figure 2: Exceedance of lifetime alcohol risk guidelines in persons aged 18 and over, by sex, 2001 to 2014–15

Note: Age-standardised to the 2001 Australian population.
Sources: AIHW analysis of ABS Microdata: National Health Survey; 1989–90, 2001, 2004–05, 2007–08, 2014–15 and Australian Health Survey; 2011–12 (see source data).
Inequalities
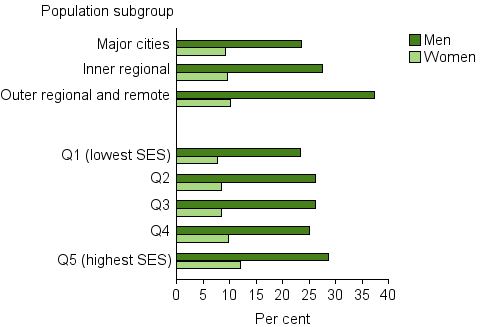
The proportion of adults at lifetime risk of harm due to alcohol consumption differs across geographic areas and socioeconomic groups (Figure 3). Adults in Outer regional and remote areas were 1.4 times as likely to exceed alcohol consumption guidelines as those in Major cities (23% and 16% respectively).
Adults living in the least disadvantaged areas were 1.3 times as likely to exceed alcohol consumption guidelines as those living in the most disadvantaged areas (20% and 15%, respectively).
Figure 3: Exceedance of lifetime alcohol risk guidelines in persons aged 18 and over, by sex, by selected population characteristics, 2014–15

Note: Q1–Q5 refers to area-based quintiles of socioeconomic position, based on the ABS Index of Relative Socio-Economic Disadvantage (IRSD) [5].
Source: AIHW analysis of ABS Microdata: National Health Survey, 2014–15.
International comparisons
International comparisons of alcohol consumption are gauged by annual sales and are converted to pure alcohol. In 2014 (or the nearest year), alcohol consumption averaged 9.7 litres (L) per person aged 15 and over in Australia. This was higher than the average across 34 OECD countries (Organisation for Economic Cooperation and Development), which was 9.0 L per person. Turkey had the lowest average (1.5 L per capita) and Belgium had the highest (12.6 L per capita). Consumption was 8.9 L per capita in the United States, 8.0 L in Canada and 9.4 L in the United Kingdom [6].
Although average adult alcohol consumption per capita gives useful comparisons, it does not identify the number of persons at risk from harmful drinking patterns.
Source data
References
- NHMRC (National Health and Medical Research Council) 2009. Australian Guidelines to reduce health risks from drinking alcohol. Canberra: National Health and Medical Research Council.
- ABS (Australian Bureau of Statistics) 2015. National Health Survey: First Results, 2014-15. ABS cat, no. 4364.0.55.001. Canberra: Australian Bureau of Statistics.
- ABS Australian Bureau of Statistics 2015. National Health Survey 2014–15 Questionnaire. ABS cat. no. 4363.0.55.001. Canberra: Australian Bureau of Statistics.
- AIHW 2017. National Drug Strategy Household Survey (NDHS) key findings: 2016. Canberra: AIHW. Viewed 6 June 2017.
- ABS 2013. Census of Population and Housing: Socio-Economic Indexes for Areas (SEIFA). ABS cat. no. 2033.0.55.001. Canberra: Australian Bureau of Statistics.
- OECD (Organisation for Economic Cooperation and Development) 2016. OECD Health Statistics 2016. Paris: Organisation for Economic Cooperation and Development Publishing. Viewed 29 June 2014.


