Impaired fasting glucose
The initial stages of type 2 diabetes, also known as pre-diabetes, are characterised by impaired glucose regulation. This includes both impaired fasting glucose (IFG) and impaired glucose tolerance (IGT). People who have IFG or IGT are at risk for future development of diabetes and cardiovascular disease.
Box 1: How is impaired fasting glucose measured?
IFG is characterised by higher than usual levels of glucose in the blood after fasting, in the range of 6.1 to 6.9 mmol/L, but lower than diabetes levels (>7.0 mmol/L).
In the Australian Bureau of Statistics (ABS) 2011–12 Australian Health Survey (AHS), a person with an IFG result ranging from 6.1 to 6.9 mmol/L (but who did not currently have diabetes) was considered to be at high risk of diabetes [1].
Presented here is information on both IFG and diabetes, with 'elevated blood glucose' defined as blood glucose level of 6.1 mmol/L and above.
Who has impaired fasting glucose?
Based on measured data from the 2011–12 AHS, 8.2% of people 18 years and over have elevated blood glucose levels. This is comprised of:
- 5.1% who have diabetes
- 3.1% who have impaired fasting glucose (IFG).
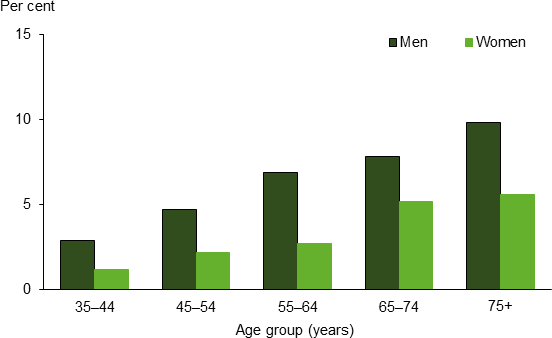
Men are more likely to have IFG than women (4.1% and 2.1% respectively) (Figure 1). The proportion of adults with IFG increases with age—2.1% of those aged 35–44, compared with 7.5% among people aged 75 and over—however, most differences are not statistically significant.
Figure 1: Prevalence of impaired fasting glucose in persons aged 18 and over, by sex, 2011–12
Notes:
-
Excludes persons with diabetes (i.e. with fasting blood glucose greater than or equal to 7.0 mmol/L), and persons who did not fast for 8 hours or more prior to their blood test.
-
Excludes age groups 18–24 and 25–34 due to small sample counts resulting in Relative Standard Errors greater than 50%.
Source: AIHW analysis of unpublished ABS 'Australian Health Survey 2011–12 (National Health Measures Survey Component)' (see source data).
Inequalities
IFG levels range from 2.7% in Major cities to 4.5% in Outer regional and remote areas, and from 4.3% among people living in the most disadvantaged areas to 2.5% among people living in the least disadvantaged areas. However, these differences by remoteness categories or socioeconomic groups are not statistically significant.
Source data
References
- ABS (Australian Bureau of Statistics) 2013. Australian Health Survey: users' guide, 2011–13. ABS cat. no. 4363.0.55.001. Canberra: Australian Bureau of Statistics.