Nutrition
The food and beverages we eat and drink (our diet) play an important role in our overall health and wellbeing. Food provides energy, nutrients and other components that, if provided in insufficient or excess amounts can result in ill health. The conditions often affected by our diet include coronary heart disease, stroke, high blood pressure, atherosclerosis, some forms of cancer, type 2 diabetes, dental caries, gall bladder disease and nutritional anaemias.
How is food associated with health?
Ill health generally cannot be attributed to any one food component alone. Diseases associated with diet are also associated with environmental, behavioural, biological, societal and genetic factors. The complex interplay between food and other risk factors and disease make it difficult to assess the contribution of diet to ill health.
In an optimal diet, the supply of required energy and nutrients is adequate for tissue maintenance, repair and growth. The proteins, carbohydrates, fats, vitamins and minerals required to maintain the human body in good health are met by eating a wide variety of nutritious foods.
More information on diet, nutrition and health can be found at the Eat for Health website.
What should Australians eat?
The Australian Dietary Guidelines [1], developed by the National Health and Medical Research Council in 2013, recommend consumption of a wide variety of nutritious food. Essential nutrients for good health are found in varying amounts throughout many different food groups. Variety in a diet maximises the possibility of obtaining enough of these essential nutrients.
The Australian Dietary Guidelines recommend adults, adolescents and children:
- Be physically active and choose amounts of nutritious food and drinks to meet energy needs.
- Drink plenty of water and enjoy a wide variety of nutritious foods from the five food groups every day:
- plenty of vegetables, including different types and colours, and legumes/beans
- fruit
- grain (cereal) foods, mostly wholegrain and/or high fibre varieties, such as breads, cereals, rice, pasta, noodles, polenta, couscous, oats, quinoa and barley
- lean meats and poultry, fish, eggs, tofu, nuts and seeds, and legumes/beans
- milk, yoghurt, cheese and/or their alternatives, mostly reduced fat (reduced fat milks are not suitable for children under the age of 2 years).
- Limit intake of foods containing saturated fat, added salt, added sugars and alcohol.
- Encourage, support and promote breastfeeding.
- Care for your food; prepare and store it safely.
Each Guideline is considered to be equally important in terms of public health outcomes.
Box 1: What is adequate fruit and vegetable intake?
The Australian Dietary Guidelines recommend that adults eat 2 serves of fruit and 5–6 serves of vegetables per day. For children and adolescents, depending on age and sex, the recommendations are for 1–2 serves of fruit and 2½ and 5½ serves of vegetables. There are different guidelines for pregnant and breastfeeding women [1].
A standard serve of fruit is about 150 grams, and a serve of vegetables is about 75 grams.
| Fruit | Vegetables |
|---|---|
| 1 small apple, orange, banana or pear | ½ cup cooked vegetables or legumes |
| 2 small apricots, kiwi fruit or plums | 1 cup green leafy or raw salad vegetables |
| 1 cup diced or canned fruit (no sugar) | ½ medium potato |
| 125 mL (½ cup) fruit juice | 1 medium tomato |
| 30 g dried fruit |
For more information on the amounts and kinds of food that you need each day to get enough nutrients essential for good health visit the Eat for Health website.
What do Australians eat?
Fruit and vegetables
Based on self-reported data from the Australian Bureau of Statistics (ABS) 2014–15 National Health Survey (NHS) , 1 in 2 people aged 18 and over (50%) did not eat the recommended 2 serves of fruit, while over 9 in 10 (93%) did not eat the recommended 5 serves of vegetables [2].
The proportion of adults with inadequate vegetable intake was similar across age groups (Figure 1). Fruit intake was worse among young people: more than half (57%) of those aged 18–24 had inadequate fruit intake, compared to one-third (35%) of people aged 85 and over.
Figure 1: Prevalence of inadequate fruit and vegetable intake for persons aged 18 and over, 2014–15
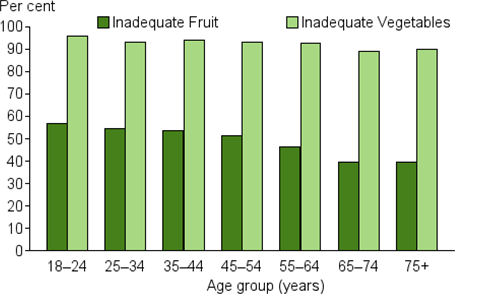
Source: National Health Survey: First Results, 2014–15. ABS cat. no. 4364.0.55.001. Canberra: Australian Bureau of Statistics (see source data).
Nutrient Reference Values
The Nutrient Reference Values (NRVs) are a set of recommendations for Australians' nutritional intake that have been developed by the NHMRC. The Estimated Average Requirement (EAR) sets a nutrient level that is used to estimate the prevalence of inadequate intakes across the population, while intakes above the Upper Level (UL) increases the risk of adverse health effects [2].
The ABS 2011–12 Australian Health Survey (AHS) indicates that:
- calcium intake across the population was largely inadequate, with 73% of females and 51% of males below the EAR
- females were more likely to have inadequate iron intake than males (23% females were below the EAR compared with 3% of males)
- 2% of males and 8% of females did not meet their iodine requirements
- almost all Australians met their nutritional needs for protein, vitamin C, vitamin B12, phosphorus and selenium (approximately 95% or more of all males and females met their requirements) [4].
Sodium
Sodium (often referred to as salt) is an important nutrient in the diet; however, too much sodium can increase blood pressure, which increases the risk of developing heart and kidney problems [3]. While sodium is found naturally in foods such as milk, cream, eggs and meat, the main source in the diet is from processed foods where sodium acts as a flavour enhancer and preservative.
The 2011–12 AHS showed that a large proportion of the population exceeded the UL for sodium, particularly younger age groups. Among children aged 2–8, almost all males exceeded the UL, as did approximately 95% of females (Figure 2).
In general, more males exceeded the UL than females and this difference was more pronounced for every age group over 9 years.
It should be noted that the sodium intake levels to estimate disease burden due to sodium in the Australian Burden of Disease Study 2011 (ABDS 2011) do not align with the UL, as it is used for the purpose of calculating disease burden in the ABDS 2011 [5].
Figure 2: Prevalence of usual intakes of sodium exceeding the UL for persons aged 2 and over, by sex, 2011–12
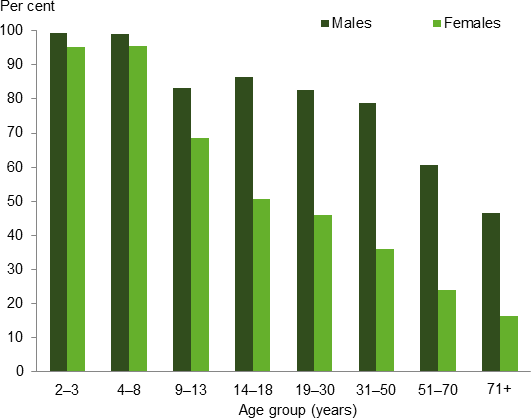
Source: ABS 2015. Australian Health Survey: Usual Nutrient Intakes, 2011–12, ABS cat. no. 4364.0.55.008, Canberra: Australian Bureau of Statistics (see source data).
Saturated fat
In the Australian population aged 2 and over, 12% of average energy intake came from saturated fat (including trans fatty acids), which is above the recommended level of no more than 10%. Between 1995 and 2011–12, saturated fat content of the diet decreased by 1 percentage point (a statistically significant reduction) [6].
Source data
References
- NHMRC (National Health and Medical Research Council) 2013. Australian Dietary Guidelines, Canberra: National Health and Medical Research Council.
- ABS (Australian Bureau of Statistics) 2015. National Health Survey: First Results, 2014–15. ABS cat, no. 4364.0.55.001. Canberra: Australian Bureau of Statistics.
- NHMRC 2006. Nutrient Reference Values for Australia and New Zealand including Recommended Dietary Intakes. Canberra: National Health and Medical Research Council.
- ABS 2015. Australian Health Survey: Usual Nutrient Intakes, 2011–12, ABS cat. no. 4364.0.55.008. Canberra: Australian Bureau of Statistics.
- AIHW 2016. Australian Burden of Disease 2011: methods and supplementary material. Australian Burden of Disease Study series no. 5. Cat. no. BOD 6. Canberra: AIHW.
- ABS 2014. Australian Health Survey: Nutrition First Results—Foods and Nutrients, 2011–12, ABS cat. no. 4364.0.55.007, Canberra: Australian Bureau of Statistics.