Dietary risk factors
In total, 12 dietary risk factors were included in the Australian Burden of Disease Study 2018. Each dietary risk was assessed independently and included dietary components where adequate amounts in the diet are required to prevent disease, as well diets where excessive consumption contributes to disease development. Information on the recommended dietary intake as part of Australian Dietary Guidelines can be found at the Eat for Health website.
All dietary risks combined
All dietary risks were responsible for 5.4% of burden of disease in Australia in 2018.
Due to the complex relationships and interactions between risk factors, the individual dietary risks cannot be summed together. To overcome this issue a combined dietary estimate was calculated, referred to as ‘all dietary risks’. These estimates reflect the amount of burden that could have been avoided if all people in Australia ate a healthy diet (see ABDS 2018 Risk factor estimates data table).
Individual dietary risks
The dietary risks included were a diet low in: fruit, vegetables, milk, nuts & seeds, whole grains & high fibre cereals, legumes, polyunsaturated fat and fish & seafood, as well as a diet high in: sodium, sugar sweetened beverages, red meat and processed meat.
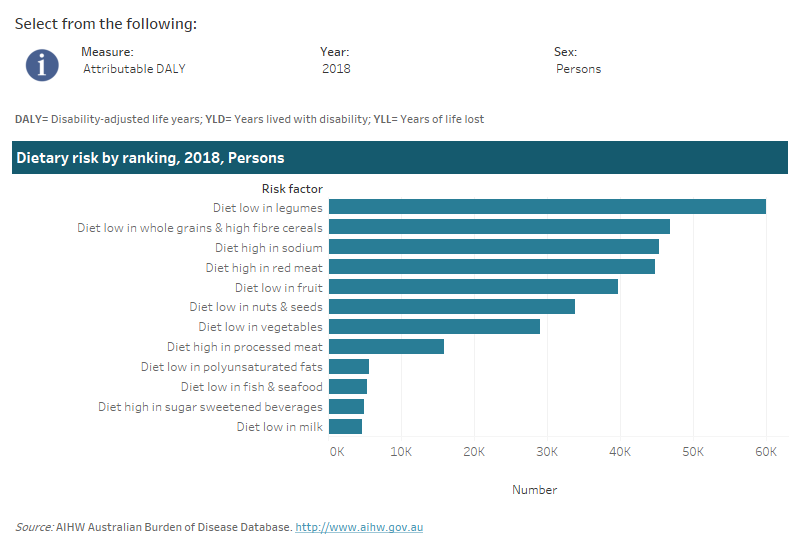
Diet low in legumes was the leading dietary risk contributing to 1.2% of the total burden in Australia in 2018. This was followed by diet low in wholegrains & high fibre cereals (0.9% of total burden in 2018), diet high in sodium (0.9%) and diet high in red meat (0.9%).
This interactive data visualisation shows the burden attributable to dietary risks by type of dietary risk. The main section shows a horizontal bar graph which can be customised to report data according to year, sex and measure of attributable burden. Each bar represents the attributable burden due to a particular type of dietary risk.
How much disease burden does each dietary risk factor cause?
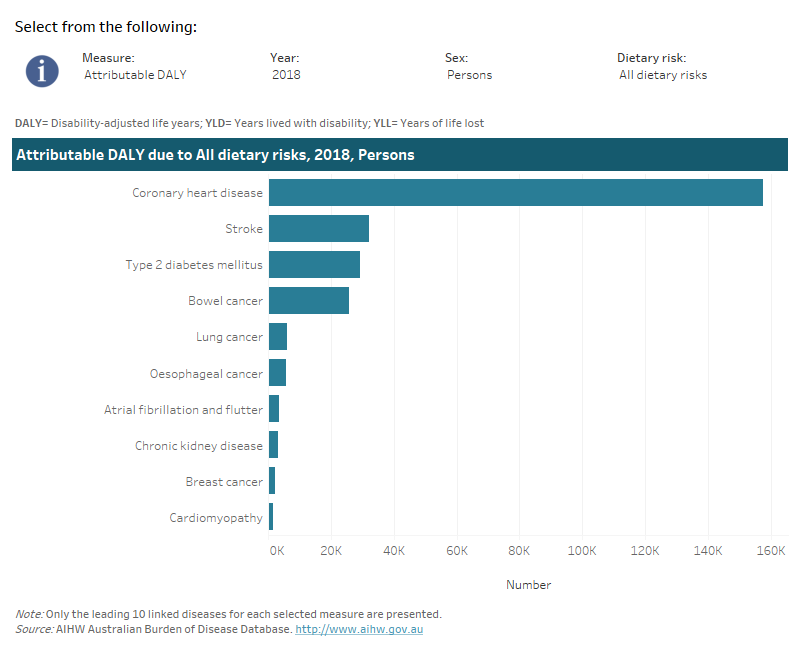
All dietary risks combined contributed 50% of coronary heart disease total burden, 26% of bowel cancer burden, 26% of type 2 diabetes burden, and 26% of stroke burden.
The combination of dietary risks were linked to 16 diseases. Note that the following visualisation displays the top 10 linked diseases due to dietary risks by selected measure (see ABDS 2018 Risk factor estimates data table).
This interactive data visualisation shows the burden attributable to dietary risks by linked disease. The main section shows a horizontal bar graph which can be customised to report data according to year, sex, type of dietary risk and measure of attributable burden. Each bar represents the attributable burden of the disease linked to the type of dietary risk.
How did burden attributable to dietary risks vary by age and sex?
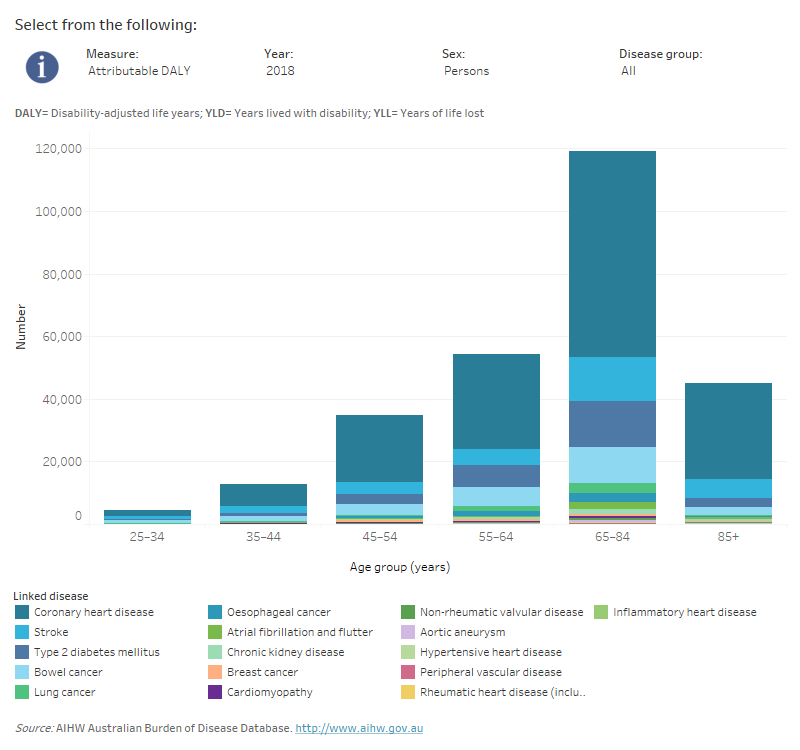
Total burden due to all dietary risks increased with age from age 25 up until age 84, then decreased among those aged 85 and over.
Males experienced a greater amount of disease burden due to all dietary risks than females in all ages up to age 84. The burden due to all dietary risks was greater in females than in males for those aged 85 years and over.
This interactive data visualisation shows the amount of burden attributable to dietary risks by age group and linked disease. The main section shows a stacked bar graph which can be customised to report data according to year, sex, disease group and measure of attributable burden. Each bar represents the attributable burden within a particular age group. Each bar is also split into separate components with each colour representing a disease linked to dietary risks.
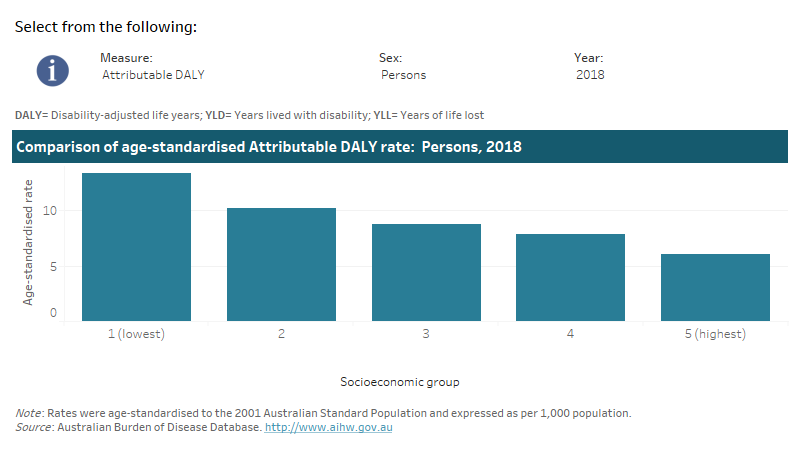
This interactive data visualisation shows the rate of burden attributable to dietary risks by socioeconomic group. The main section shows a bar graph which can be customised to report data according to year, sex and measure of attributable burden. Each bar represents the attributable burden within a particular socioeconomic group due to dietary risks.
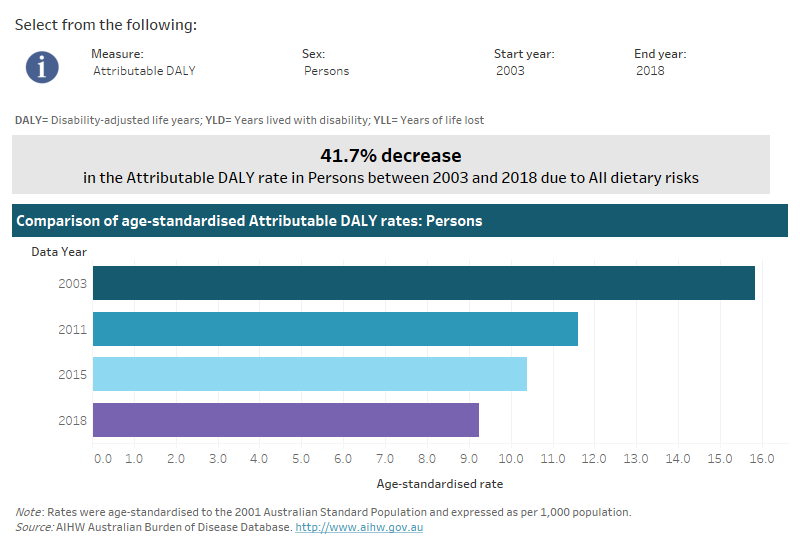
This interactive data visualisation shows the rate of burden attributable to dietary risks by year. The main section shows a horizontal bar graph which can be customised to report data according to year, sex and measure of attributable burden. Each bar represents the attributable burden within a particular year due to dietary risks.
