Occupational exposures and hazards
In 2018, 1.8% of the total burden in Australia was due to occupational exposures & hazards.
These estimates reflect the amount of burden that could have been avoided if all people in Australia were not exposed to occupational exposures & hazards including injuries, loud noise, carcinogens, particulate matter, gas and fumes, asthmagens and ergonomic factors.
In 2018, occupational exposures & hazards was linked to 26 diseases and injuries including 11 types of cancer, 8 types of injury, hearing loss, back pain & problems, asthma, chronic obstructive pulmonary disease (COPD), silicosis, asbestosis and other pneumoconiosis (see Table 1 below and ABDS 2018 Risk factor estimates data table).
| Occupational exposure or hazard | Linked disease |
|---|---|
| Injury | Drowning, falls, fire, burns and scalds, homicide and violence, road traffic injuries—motor vehicle occupants, road traffic injuries—motorcyclists, other unintentional injuries, other land transport injuries |
| Benzene or formaldehyde | Acute myeloid leukaemia, Chronic myeloid leukaemia, Chronic lymphocytic leukaemia, Acute lymphoblastic leukaemia, Other leukaemias, nasopharyngeal cancer |
| Noise | Hearing loss |
| Arsenic, beryllium, cadmium chromium, diesel engine exhaust, polycyclic aromatic hydrocarbons, nickel, second-hand smoke, silica | Lung cancer |
| Sulfuric acid | Laryngeal cancer |
| Trichloroethylene | Kidney cancer |
| Particulate matter, gas and fumes | COPD |
| Asbestos | Laryngeal cancer, lung cancer, ovarian cancer mesothelioma |
| Asbestos, silicone and particulate matter | Silicosis, asbestosis and other pneumoconiosis |
| Asthmagens | Asthma |
| Ergonomic factors | Back pain & problems |
How much burden was attributable to occupational exposures and hazards?
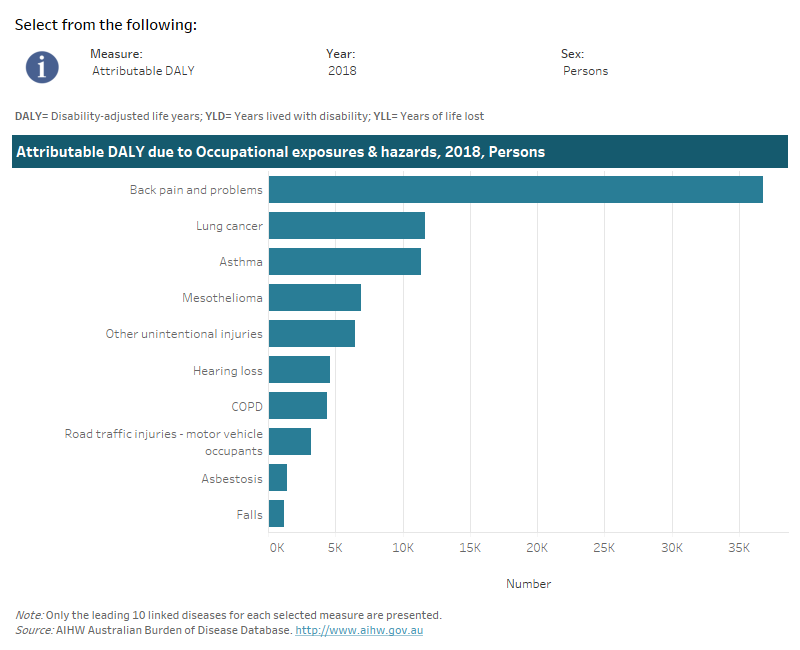
Occupational exposures & hazards were responsible for the entire burden from silicosis asbestosis and other pneumoconiosis, 65% of mesothelioma burden, 22% of burden from other unintentional injuries, 17% of back pain & problems burden, 12% of burden from fire, burns and scalds, 9% of burden from other land transport injuries, 9% of asthma burden and 8% of road traffic injuries of motor vehicle occupants burden.
Note that the following visualisation displays only the top 10 linked diseases due to occupational exposures & hazards.
This interactive data visualisation shows the burden attributable to occupational exposures and hazards by linked disease. The main section shows a horizontal bar graph which can be customised to report data according to year, sex and measure of attributable burden. Each bar represents the attributable burden of the disease linked to occupational exposures and hazards.

How did burden attributable to occupational exposures and hazards vary by age and sex?
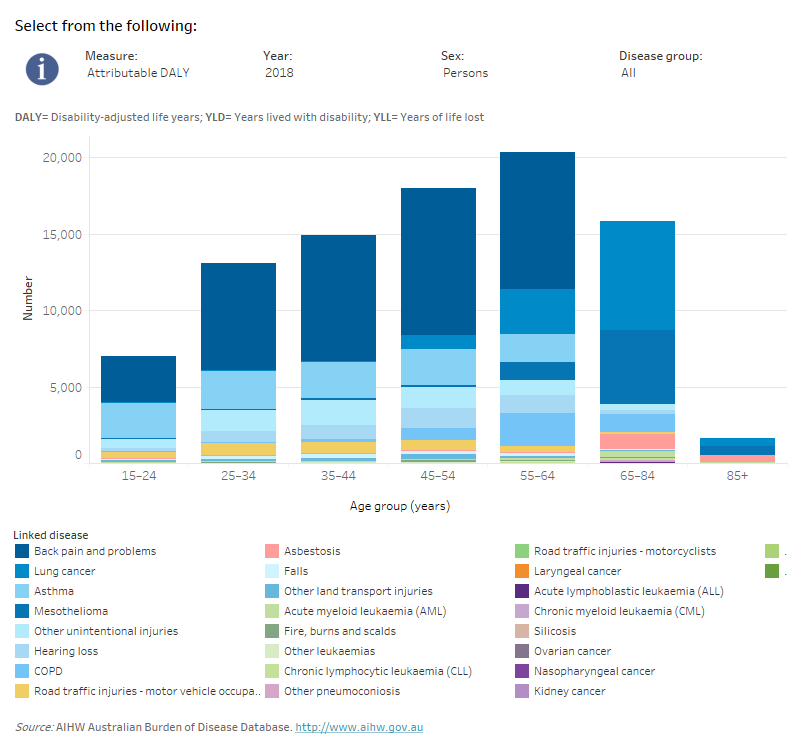
Burden due to occupational exposures & hazards was estimated in people aged 15 and over. Total burden increased with age, peaking at ages 55–64 years.
In people aged 15–64 years, the most burden due to occupational exposures & hazards was from back pain & problems followed by asthma. In ages 65 and over, the most burden due to occupational exposures & hazards was from lung cancer and mesothelioma.
Across all ages, males experienced almost three times the amount of total burden due to occupational exposures & hazards compared with females.
This interactive data visualisation shows the amount of burden attributable to occupational exposures and hazards by age group and linked disease. The main section shows a stacked bar graph which can be customised to report data according to year, sex, disease group and measure of attributable burden. Each bar represents the attributable burden within a particular age group. Each bar is also split into separate components with each colour representing a disease linked to occupational exposures and hazards.

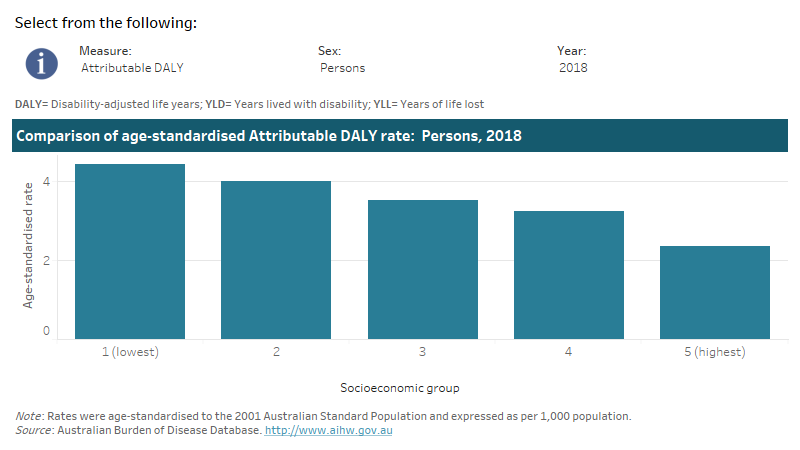
This interactive data visualisation shows the rate of burden attributable to occupational exposures and hazards by socioeconomic group. The main section shows a bar graph which can be customised to report data according to year, sex and measure of attributable burden. Each bar represents the attributable burden within a particular socioeconomic group due to occupational exposures and hazards.

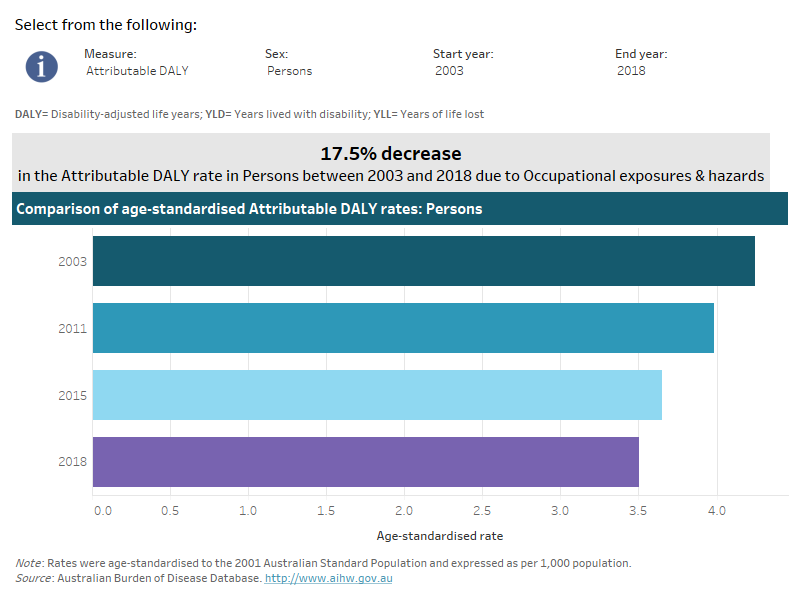
This interactive data visualisation shows the rate of burden attributable to occupational exposures and hazards by year. The main section shows a horizontal bar graph which can be customised to report data according to year, sex and measure of attributable burden. Each bar represents the attributable burden within a particular year due to occupational exposures and hazards


