Intimate partner violence
In 2018, intimate partner violence contributed to 1.4% of the total disease burden in Australian women.
These estimates reflect the amount of disease burden that could have been avoided if all women aged 15 and over in Australia were not exposed to intimate partner violence, which for this study included emotional, physical and sexual intimate partner violence by a cohabiting current or previous intimate partner.
Intimate partner violence was causally linked to homicide & violence, suicide & self-inflicted injuries, alcohol use disorders, depression, anxiety and early pregnancy loss (see ABDS 2018 Risk factor estimates data table). The impact of this risk factor was estimated only in women as sufficient evidence in the literature to identify the causally linked diseases and the amount of increased risk (relative risk) is not currently available for men (AIHW unpublished; Ayre et al. 2016; GBD 2019 Risk Factor Collaborators 2019).
How much burden was attributable to intimate partner violence?
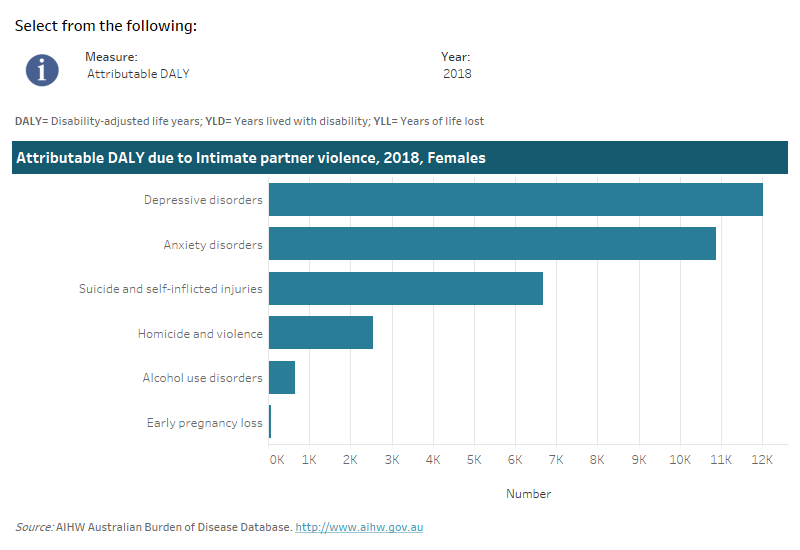
Intimate partner violence contributed 46% of homicide & violence total burden, 19% of suicide & self-inflicted injuries burden, 15% of depressive disorders burden, 17% of early pregnancy loss burden, 11% of anxiety disorders burden and 4% of alcohol use burden in females.
This interactive data visualisation shows the burden attributable to intimate partner violence by linked disease. The main section shows a horizontal bar graph which can be customised to report data according to year and measure of attributable burden. Each bar represents the attributable burden of the disease linked to intimate partner violence.

How did burden attributable to intimate partner violence vary by age?
Burden from intimate partner violence was estimated in women aged 15 and over.
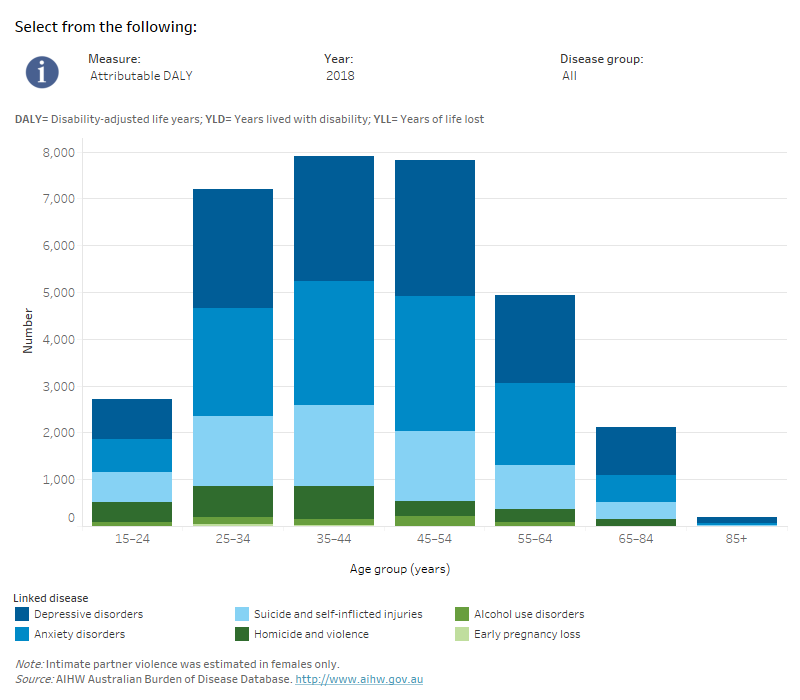
Total burden due to intimate partner violence was highest for women between ages 35–44 years. The most burden due to intimate partner violence in this age group was from depressive disorders, anxiety disorders, and suicide & self-inflicted injuries.
This interactive data visualisation shows the amount of burden attributable to intimate partner violence by age group and linked disease. The main section shows a stacked bar graph which can be customised to report data according to year, disease group and measure of attributable burden. Each bar represents the attributable burden within a particular age group. Each bar is also split into separate components with each colour representing a disease linked to intimate partner violence.

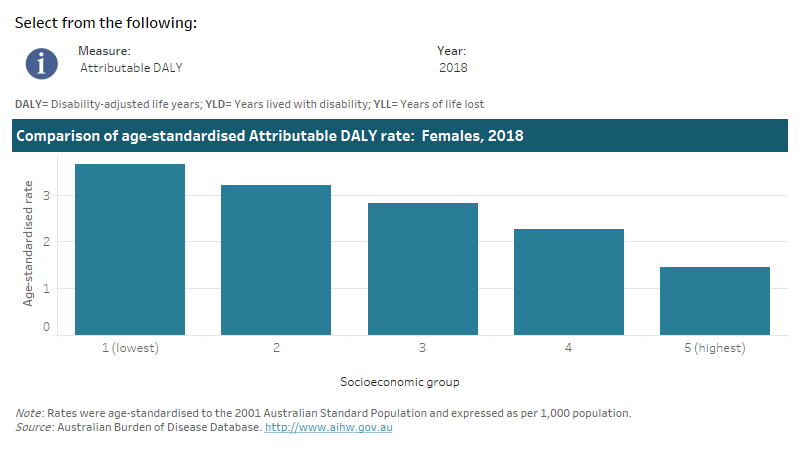
This interactive data visualisation shows the rate of burden attributable to intimate partner violence by socioeconomic group. The main section shows a bar graph which can be customised to report data according to year and measure of attributable burden. Each bar represents the attributable burden within a particular socioeconomic group due to intimate partner violence.

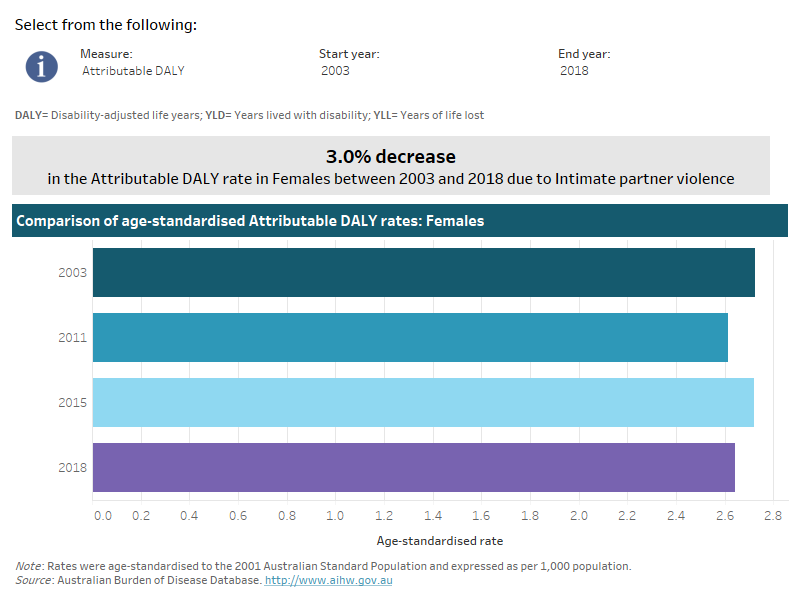
This interactive data visualisation shows the rate of burden attributable to intimate partner violence by year. The main section shows a horizontal bar graph which can be customised to report data according to year and measure of attributable burden. Each bar represents the attributable burden within a particular year due to intimate partner violence.

References
AIHW unpublished. Health outcomes of violence: A review of data sources and evidence. Report to the Australian Government Department of Social Services.
Ayre J, Lum On M, Webster K & Moon L 2016. Examination of the burden of disease of intimate partner violence against women: Final report, 2011. Sydney: Australian National Research Organisation for Women’s Safety.
GBD 2016 Risk Factors Collaborators 2017. Global, regional, and national comparative risk assessment of 84 behavioural, environmental and occupational, and metabolic risks or clusters of risks, 1990–2016: a systematic analysis for the Global Burden of Disease Study 2016. The Lancet 390:1345–422.


