Has the use of care and protections orders changed over time?
Children discharged from orders increased over time
The number of children admitted to care and protection orders fluctuates each year, but overall has remained relatively stable between 2016–17 and 2020–21 (12,300 to 12,100) (Figure 4.8).
The number of children discharged from orders has increased 9.1% (from 10,800 in 2016–17 to 11,800 in 2020–21) (Figure 4.8).
Figure 4.8: Trends in children admitted to, and discharged from, care and protection orders, 2016–17 to 2020–21 (number)
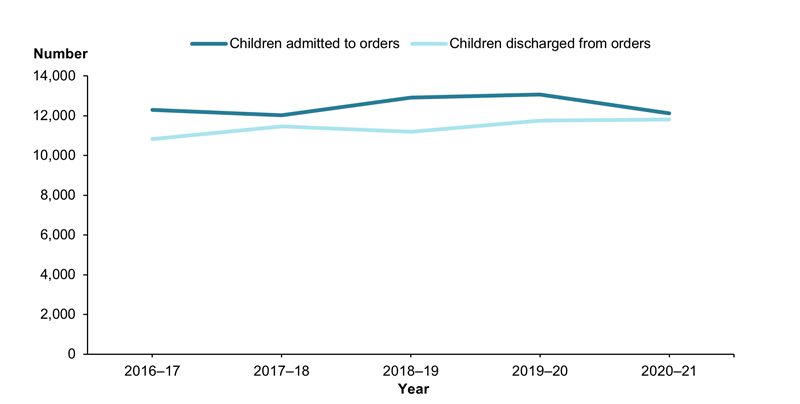
Note: For details on the methodology used to count admissions and discharges from care and protection orders, see Technical notes.
Chart: AIHW.
Sources: Supplementary data tables S4.11 and S4.12, AIHW Child Protection Collection 2020–21.
The rate of Aboriginal and Torres Strait Islander children on orders increased over time
From 30 June 2017 to 30 June 2021, the rate of children aged 0–17 on care and protection orders rose from 10 to 11 per 1,000 children (Table A1).
Over the 5-year period, the number of Indigenous children on care and protection orders rose steadily, from 19,700 on 30 June 2017 to 24,200 on 30 June 2021, with rates rising from 60 to 71 per 1,000 Indigenous children (Table T2).
While the number of non-Indigenous children on care and protection orders rose from 34,800 to 37,500 in the same period, the rate remained relatively stable at around 7 per 1,000 non-Indigenous children (Figure 4.9).
Figure 4.9: Trends in children on care and protection orders, by Indigenous status, 30 June 2017 to 30 June 2021 (rate)
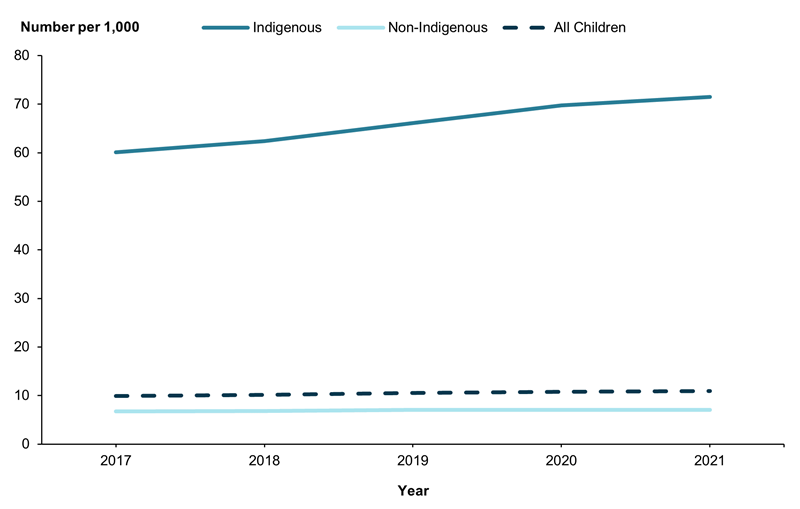
Note: See Technical notes for the method used to calculate rates.
Chart: AIHW.
Source: Supplementary data table T2, AIHW Child Protection Collection 2020–21.