Has the number of notifications, investigations and substantiations changed over time?
On this page:
Box 3.2: Trend data limitations
New South Wales implemented a new client management system in 2017–18 and provided limited data. As a result, substantiations data are unavailable for this period. New South Wales remedied this issue and have provided substantiations data from 2018–19 onwards. Trends in this section should be interpreted with caution and should not be compared to previous versions of Child protection Australia.
See Box 1.2 for further information about data limitations specific to this report.
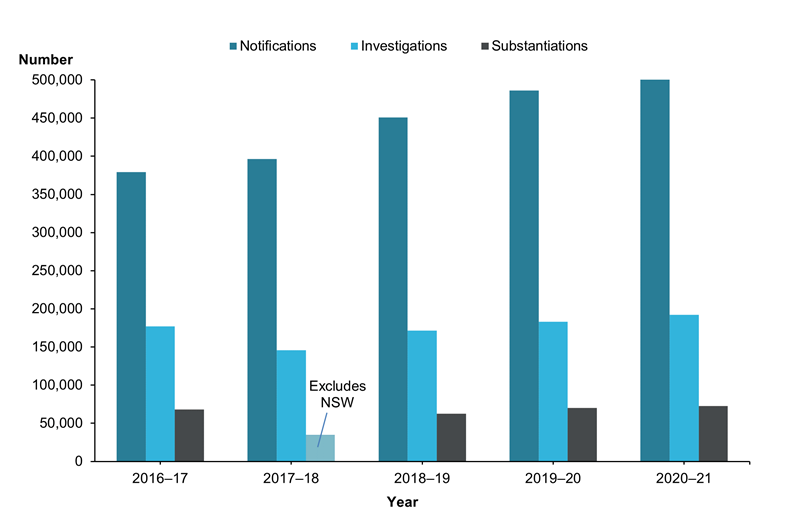
Between 2016–17 and 2020–21, numbers rose by:
- 40% for notifications (379,500 in 2016–17 to 531,900 in 2020–21)
- 8.5% for investigations (177,100 in 2016–17 to 192,100 in 2020–21)
- 7.2% for substantiations (68,000 in 2016–17 to 72,900 in 2020–21) (Figure 3.10)
Although nationally notifications and substantiations rose over the 5 years, the size and direction of change varied across jurisdictions (supplementary tables S3.11 and S3.12).
Figure 3.10: Trends in notifications, investigations and substantiations, 2016–17 to 2020–21
Notes:
- Data presented in this figure are not comparable over time due to differences in the way jurisdictions collect and report data on notifications, investigations and substantiations and how this has changed over time. See Appendix A for more information.
- For 2017–18 onwards, New South Wales data for ‘Investigation’ and ‘Dealt with by other means’ are not comparable with data published previously. ‘Investigation’ counts changed to only include field assessments, while all office-based assessments are now counted in the ‘Dealt with by other means’ category.
- Substantiations data are unavailable for New South Wales for 2017–18, as the state implemented a new client management system during that year.
Chart: AIHW.
Source: Supplementary data table T1, AIHW Child Protection Collection 2020–21.
The rate of children subject to substantiations has remained stable
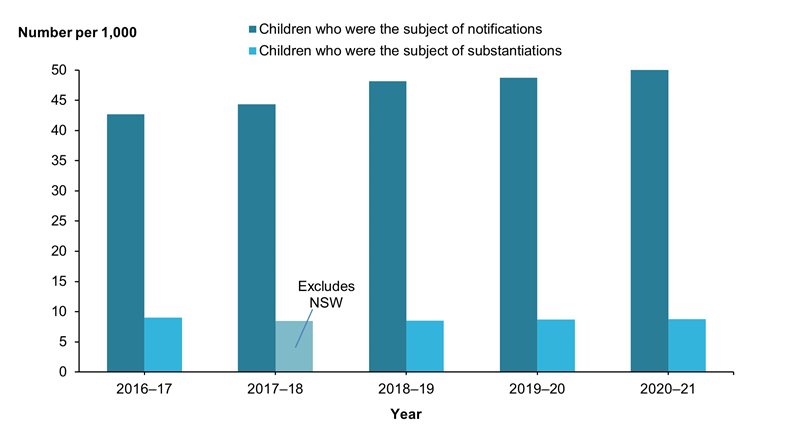
The rate of children who were the subjects of notifications rose from 43 per 1,000 children in 2016–17 to 52 per 1,000 in 2020–21 (Figure 3.11).
The rate of children who were the subjects of substantiations has remained stable from 2016–17 to 2020–21, at 9 per 1,000 children.
For state/territory trend data on the number and rate of children who were the subjects of substantiations between 2016–17 and 2020–21, see Table A1.
Legislative changes, increased public awareness, and inquiries into child protection processes, along with real rises in abuse and neglect, could influence increases in the number of notifications and the number of children who were the subject of them.
Information on state and territory policies and practices, and on the various inquiries into state and territory child protection services that might have increased public awareness, is provided in Appendixes A–C.
Figure 3.11: Children who were the subjects of child protection notifications and substantiations, 2016–17 to 2020–21 (rate)
Notes:
- Data presented in this figure are not comparable over time due to differences in the way jurisdictions collect and report data on notifications, investigations and substantiations and how this has changed over time. See Appendix A for more information.
- Substantiations data are unavailable for New South Wales for 2017–18, as the state implemented a new client management system during that year.
- See Technical notes for the method used to calculate rates.
Chart: AIHW.
Source: Supplementary data table T1, AIHW Child Protection Collection 2020–21.
Children aged under one were subjects of substantiations more than any other age group
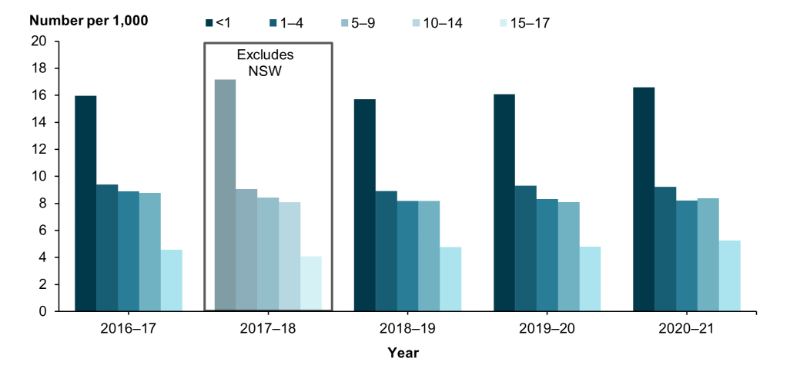
Since 2016–17, the rates of children aged under one who were the subjects of substantiations have been consistently higher than the rates for any other age group. The rate of children aged under one who were the subjects of substantiations was up slightly in 2020–21 (17 per 1,000 children) compared to 2016–17 (16 per 1,000 children) with minor fluctuations during the period. The rates for most other age groups remained either relatively stable or varied slightly over the 5‑year period (Figure 3.12).
Figure 3.12: Trends in children who were the subjects of substantiations, by age group, 2016–17 to 2020–21 (rate)
Notes:
- Data presented in this figure are not comparable over time due to differences in the way jurisdictions collect and report data on notifications, investigations and substantiations and how this has changed over time. See Appendix A for more information.
- Substantiations data are unavailable for New South Wales for 2017–18, as the state implemented a new client management system during that year.
- Unborn children might be covered under child protection legislation, so are included elsewhere in this report. But they are excluded from the ‘less than one year’ age group in this figure.
- See Technical notes for the method used to calculate rates.
Chart: AIHW.
Source: Supplementary data table S3.13, AIHW Child Protection Collection 2020–21.
Rates of emotional abuse were the highest of all abuse and neglect types
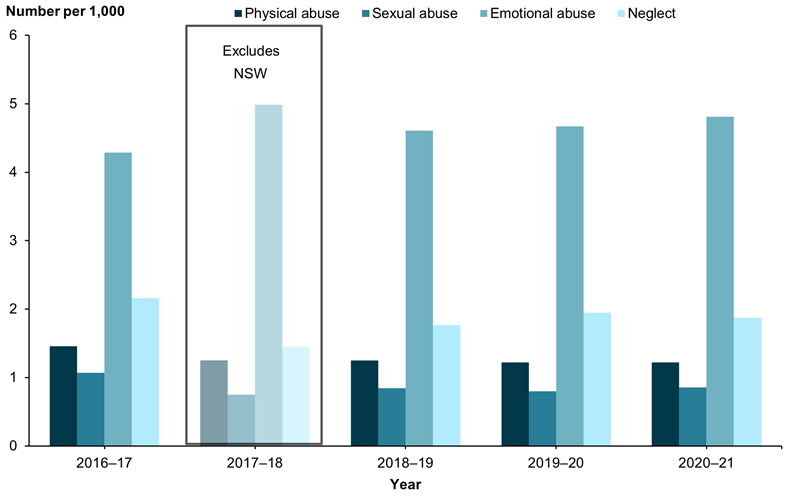
Between 2016–17 and 2020–21, the rates of children who were the subjects of substantiations for emotional abuse were the highest of all types of abuse or neglect. The rate of emotional abuse increased slightly from 4 to 5 per 1,000 children over this time.
The rates for all other types of abuse remained relatively unchanged over the 5 years to 2020–21 (Figure 3.13).
Figure 3.13: Trends in children who were the subjects of substantiations, by type of abuse or neglect, 2016–17 to 2020–21 (rate)
Notes:
- Data presented in this figure are not comparable over time due to differences in the way jurisdictions collect and report data on notifications, investigations and substantiations and how this has changed over time. See Appendix A for more information.
- Substantiations data are unavailable for New South Wales for 2017–18, as the state implemented a new client management system during that year.
- See Technical notes for the method used to calculate rates.
Chart: AIHW.
Source: Supplementary data table S3.14, AIHW Child Protection Collection 2020–21.