Has the provision of child protection services changed over time?
The number of children receiving child protection services rose about 6.2% over 5 years – from about 168,300 children in 2016–17 to about 178,800 children in 2020–21 (AIHW 2018). The rate of children receiving child protection services was slightly higher in 2020–21 compared with 2016–17 (32 per 1,000 versus 31 per 1,000 children) with minor fluctuations during the period (Table A1).
Changes over time in the rate of children receiving child protection services or support might relate to changes in the underlying rate of child abuse and neglect, increases in notifications and access to services, or a combination of these factors.
The rate for Aboriginal and Torres Strait Islander children increased
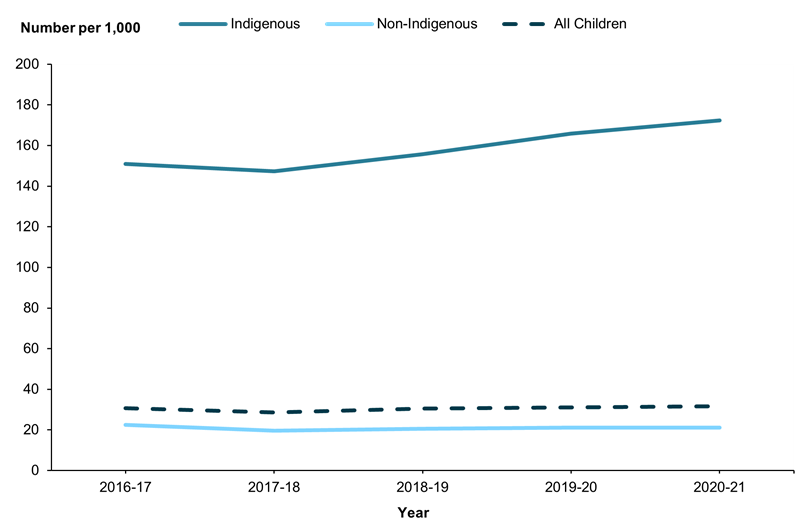
The number of Indigenous children receiving child protection services increased from 49,200 (151 per 1,000) in 2016–17 to 58,000 (172 per 1,000) in 2020–21. For non-Indigenous children the rates decreased slightly from 22 to 21 per 1,000 children, with minor fluctuations during the period (Figure 2.7).
Figure 2.7: Children receiving child protection services, by Indigenous status, 2016–17 to 2020–21 (rate)
Notes:
- Data presented in this figure are not comparable over time, due to differences in the way jurisdictions have collected and reported data on notifications, investigations and substantiations. See Appendix A for more information.
- See Technical notes for the method used to calculate rates.
Chart: AIHW.
Source: Supplementary data table T2, AIHW Child Protection Collection 2020–21.
References
For a full list of references, go to References.