How many notifications and investigations were there?
Of the approximately 531,900 notifications in 2020–21, about 192,100 (36%) were assessed as requiring further investigation and the rest (339,700 or 64%) were dealt with by other means, such as by being referred to a support service (Supplementary table S3.1).
For investigations in 2020–21, the most common source of the notification was police (21%), followed by school personnel (20%) (Figure 3.2). Nationally, less than 1% of notifications came directly from the child involved (Supplementary table S3.2).
Notifications to departments responsible for child protection come from various sources, and legislation for mandatory reporting varies across jurisdictions. This should be taken into consideration when interpreting these data. For more information, see mandatory reporting information by jurisdiction.
Figure 3.2: Investigations, by most common source of notification, 2020–21 (per cent)
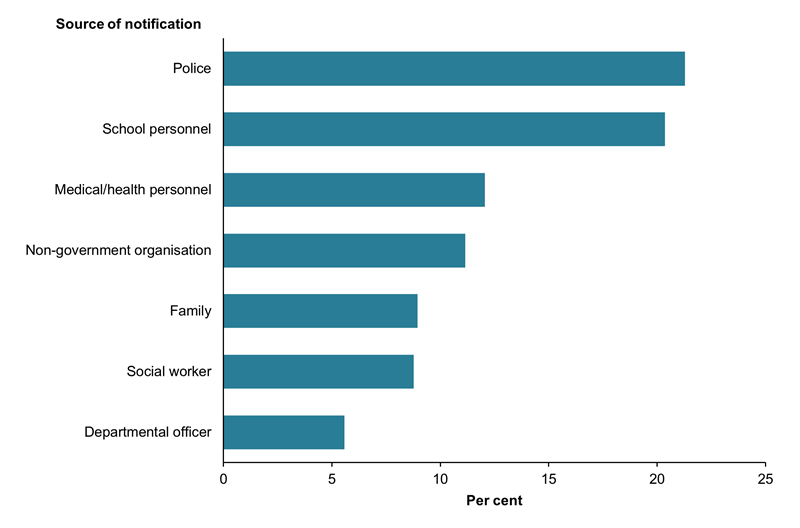
Note: Not all notification sources are shown – see Supplementary table S3.2 for more information.
Chart: AIHW.
Source: Supplementary data table S3.2, AIHW Child Protection Collection 2020–21
Finalised investigations are notifications made during 2020–21 that were investigated and for which an outcome of either ‘substantiated’ or ‘not substantiated’ was recorded by 31 August 2021. The cut-off point of 31 August allows time to investigate notifications made close to the end of the financial year. The outcomes of investigations that are still in process after this cut-off (6.3% of total notifications or 9.1% of children in investigations) are not reported in the data for this or subsequent reporting periods (supplementary tables S3.1 and S3.3). See for more information on investigations in process.
Almost half (47%) of the children in finalised investigations were the subjects of substantiations in 2020–21 (Figure 3.3).
Figure 3.3: Children who were the subject of finalised investigations, by outcome and state or territory, 2020–21 (per cent)
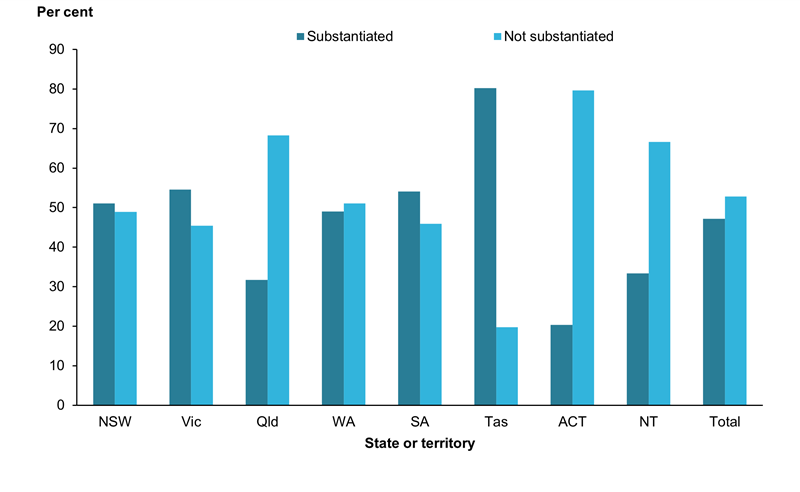
Note: Data presented in this figure are not comparable across jurisdictions due to differences in the way jurisdictions collect and report data on notifications, investigations and substantiations. See Appendix A for more information.
Chart: AIHW.
Source: Supplementary data table S3.3, AIHW Child Protection Collection 2020–21.