Potentially preventable dental hospitalisations
KPI 19: Rate (per 1,000 population) of potentially preventable hospitalisations for dental conditions in children under 10 years of age
Hospital separation rates for potentially preventable hospitalisations provide important information about the extent to which timely and adequate non-hospital dental care has been provided. The rate of potentially preventable hospitalisations for dental conditions is influenced by a number of factors including:
- adequacy of preventive and primary care services
- prevalence of severe dental disease in the community
- availability and accessibility of appropriate community and hospital-based services (COAG 2015).
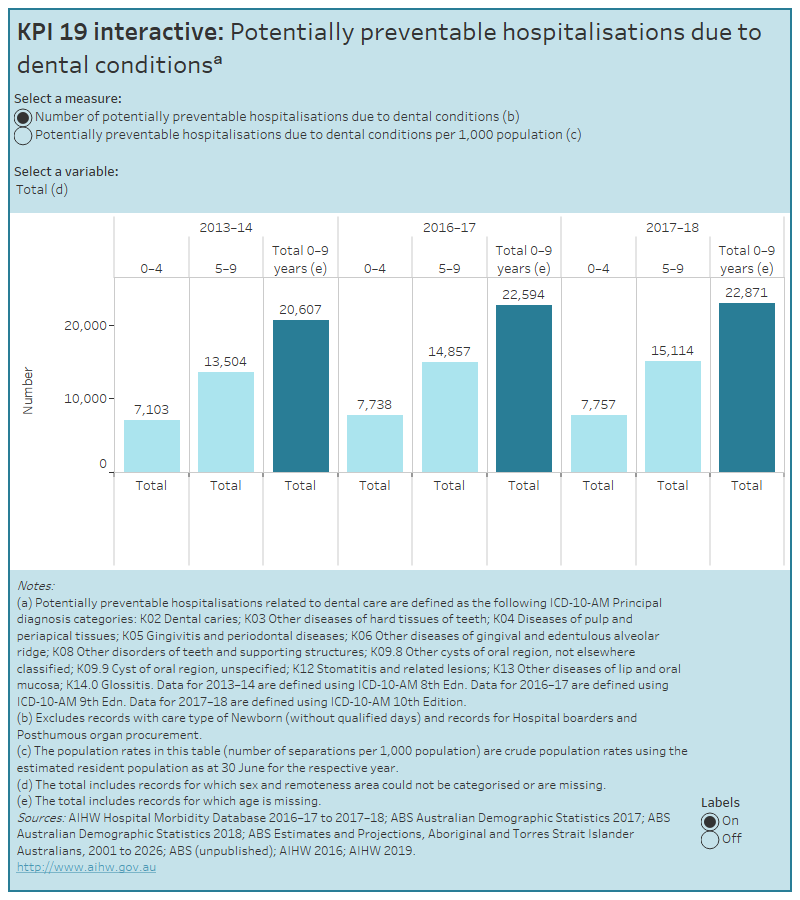
In 2017–18, about 22,900 hospitalisations for dental conditions of children aged 0–9 years may have been prevented with earlier treatment. This represents a rate of 7.2 per 1,000 population, which is a slight increase from 6.9 per 1,000 population in 2013–14. In 2017–18, the rate was highest for children aged 5–9 years at 9.5 per 1,000 population
Explore the data using the interactive below:
KPI 19 interactive: Potentially preventable hospitalisations due to dental conditions
This figure shows the number and rate per 1,000 population of potentially preventable hospitalisations due to dental conditions in Australia in 2013-14, 2016-17 and 2018-19. Data are presented for children aged 0–4, 5–9 and 0–9 years, by selected variables. In 2017–18, 22,871 children aged 0–9 years were hospitalised for dental conditions which may have been prevented with earlier treatment.

Data tables available for download.
More information about potentially preventable hospitalisations.
References:
ABS 2014. Estimates and projections, Aboriginal and Torres Strait Islander Australians, 2001 to 2026. ABS cat no. 3238.0. Projection series B. Canberra: ABS.
ABS 2017. Australian demographic statistics, December 2016. ABS cat no. 3101.0. Canberra: ABS.
ABS 2018. Australian demographic statistics, December 2017. ABS cat no. 3101.0. Canberra: ABS
AIHW: Chrisopoulos S, Harford JE & Ellershaw A 2016. Oral health and dental care in Australia: key facts and figures 2015. Cat. no. DEN 229. Canberra: AIHW.
Australian Institute of Health and Welfare 2019. Oral health and dental care in Australia. Cat. no. DEN 231. Canberra: AIHW. Viewed 30 October 2019, https://www.aihw.gov.au/reports/dental-oral-health/oral-health-and-dental-care-in-australia
COAG (Council of Australian Governments) Health Council 2015. Healthy mouths, healthy lives: Australia’s National Oral Health Plan 2015–2024. Adelaide: South Australian Dental Service.
|
Definition |
Rate (per 1,000 population) of potentially preventable hospitalisations for dental conditions in children under 10 years of age Numerator Denominator |
|---|---|
|
Desirable rate |
Low |
|
Data sources |
NHMD ABS ERP |
|
Inclusions |
Principal diagnosis categories(1) |
|
Exclusions |
Care types |
- Diagnosis coding based on the International Statistical Classification of Diseases and Related Health Problems, 10th edition, Australian modification (ICD–10–AM)


