Newly registered dental practitioners, by division
KPI 21: The proportion of newly registered dental practitioners, by dental practitioner division
The aim of this indicator is to monitor trends in dental practitioner initial registrations to assist in future oral health workforce planning strategies.
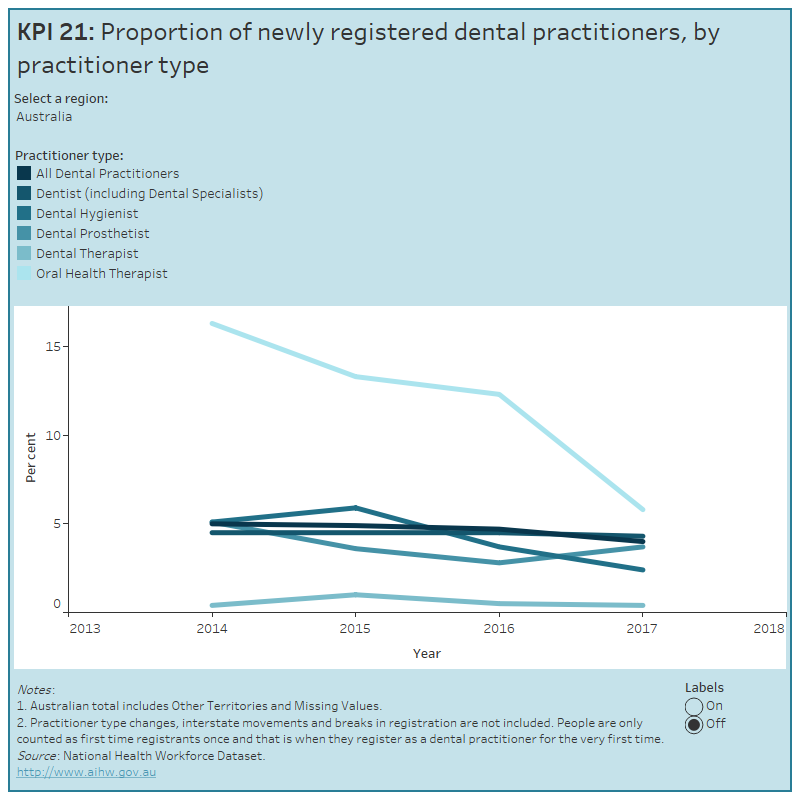
The proportion of newly registered dental practitioners has declined slightly over time, from 5.0% in 2014 to 4.0% in 2017. The dental practitioner division which showed the greatest decline was that of Oral Health Therapists, dropping around 10 percentage points from 16% in 2014 to 5.8% in 2017.
Explore the data using the interactive below:
KPI 21: Proportion of newly registered dental practitioners, by practitioner type
This figure shows the proportion of newly registered dental practitioners, by practitioner type. National, state and territory data is presented for 2013 and 2017. In 2017, 4% of all dental practitioners were newly registered.

Data tables available for download.
More information about the dental workforce.
|
Definition |
The proportion of new registered dental practitioners, by dental practitioner division (type) Numerator Denominator |
|---|---|
|
Desirable rate |
High |
|
Data sources |
Department of Health |
|
Inclusions |
Registration type Practitioner type Practitioner type changes Interstate movements Breaks in registration |
|
Exclusions |
Practitioner type |


