Comparisons across survey cycles
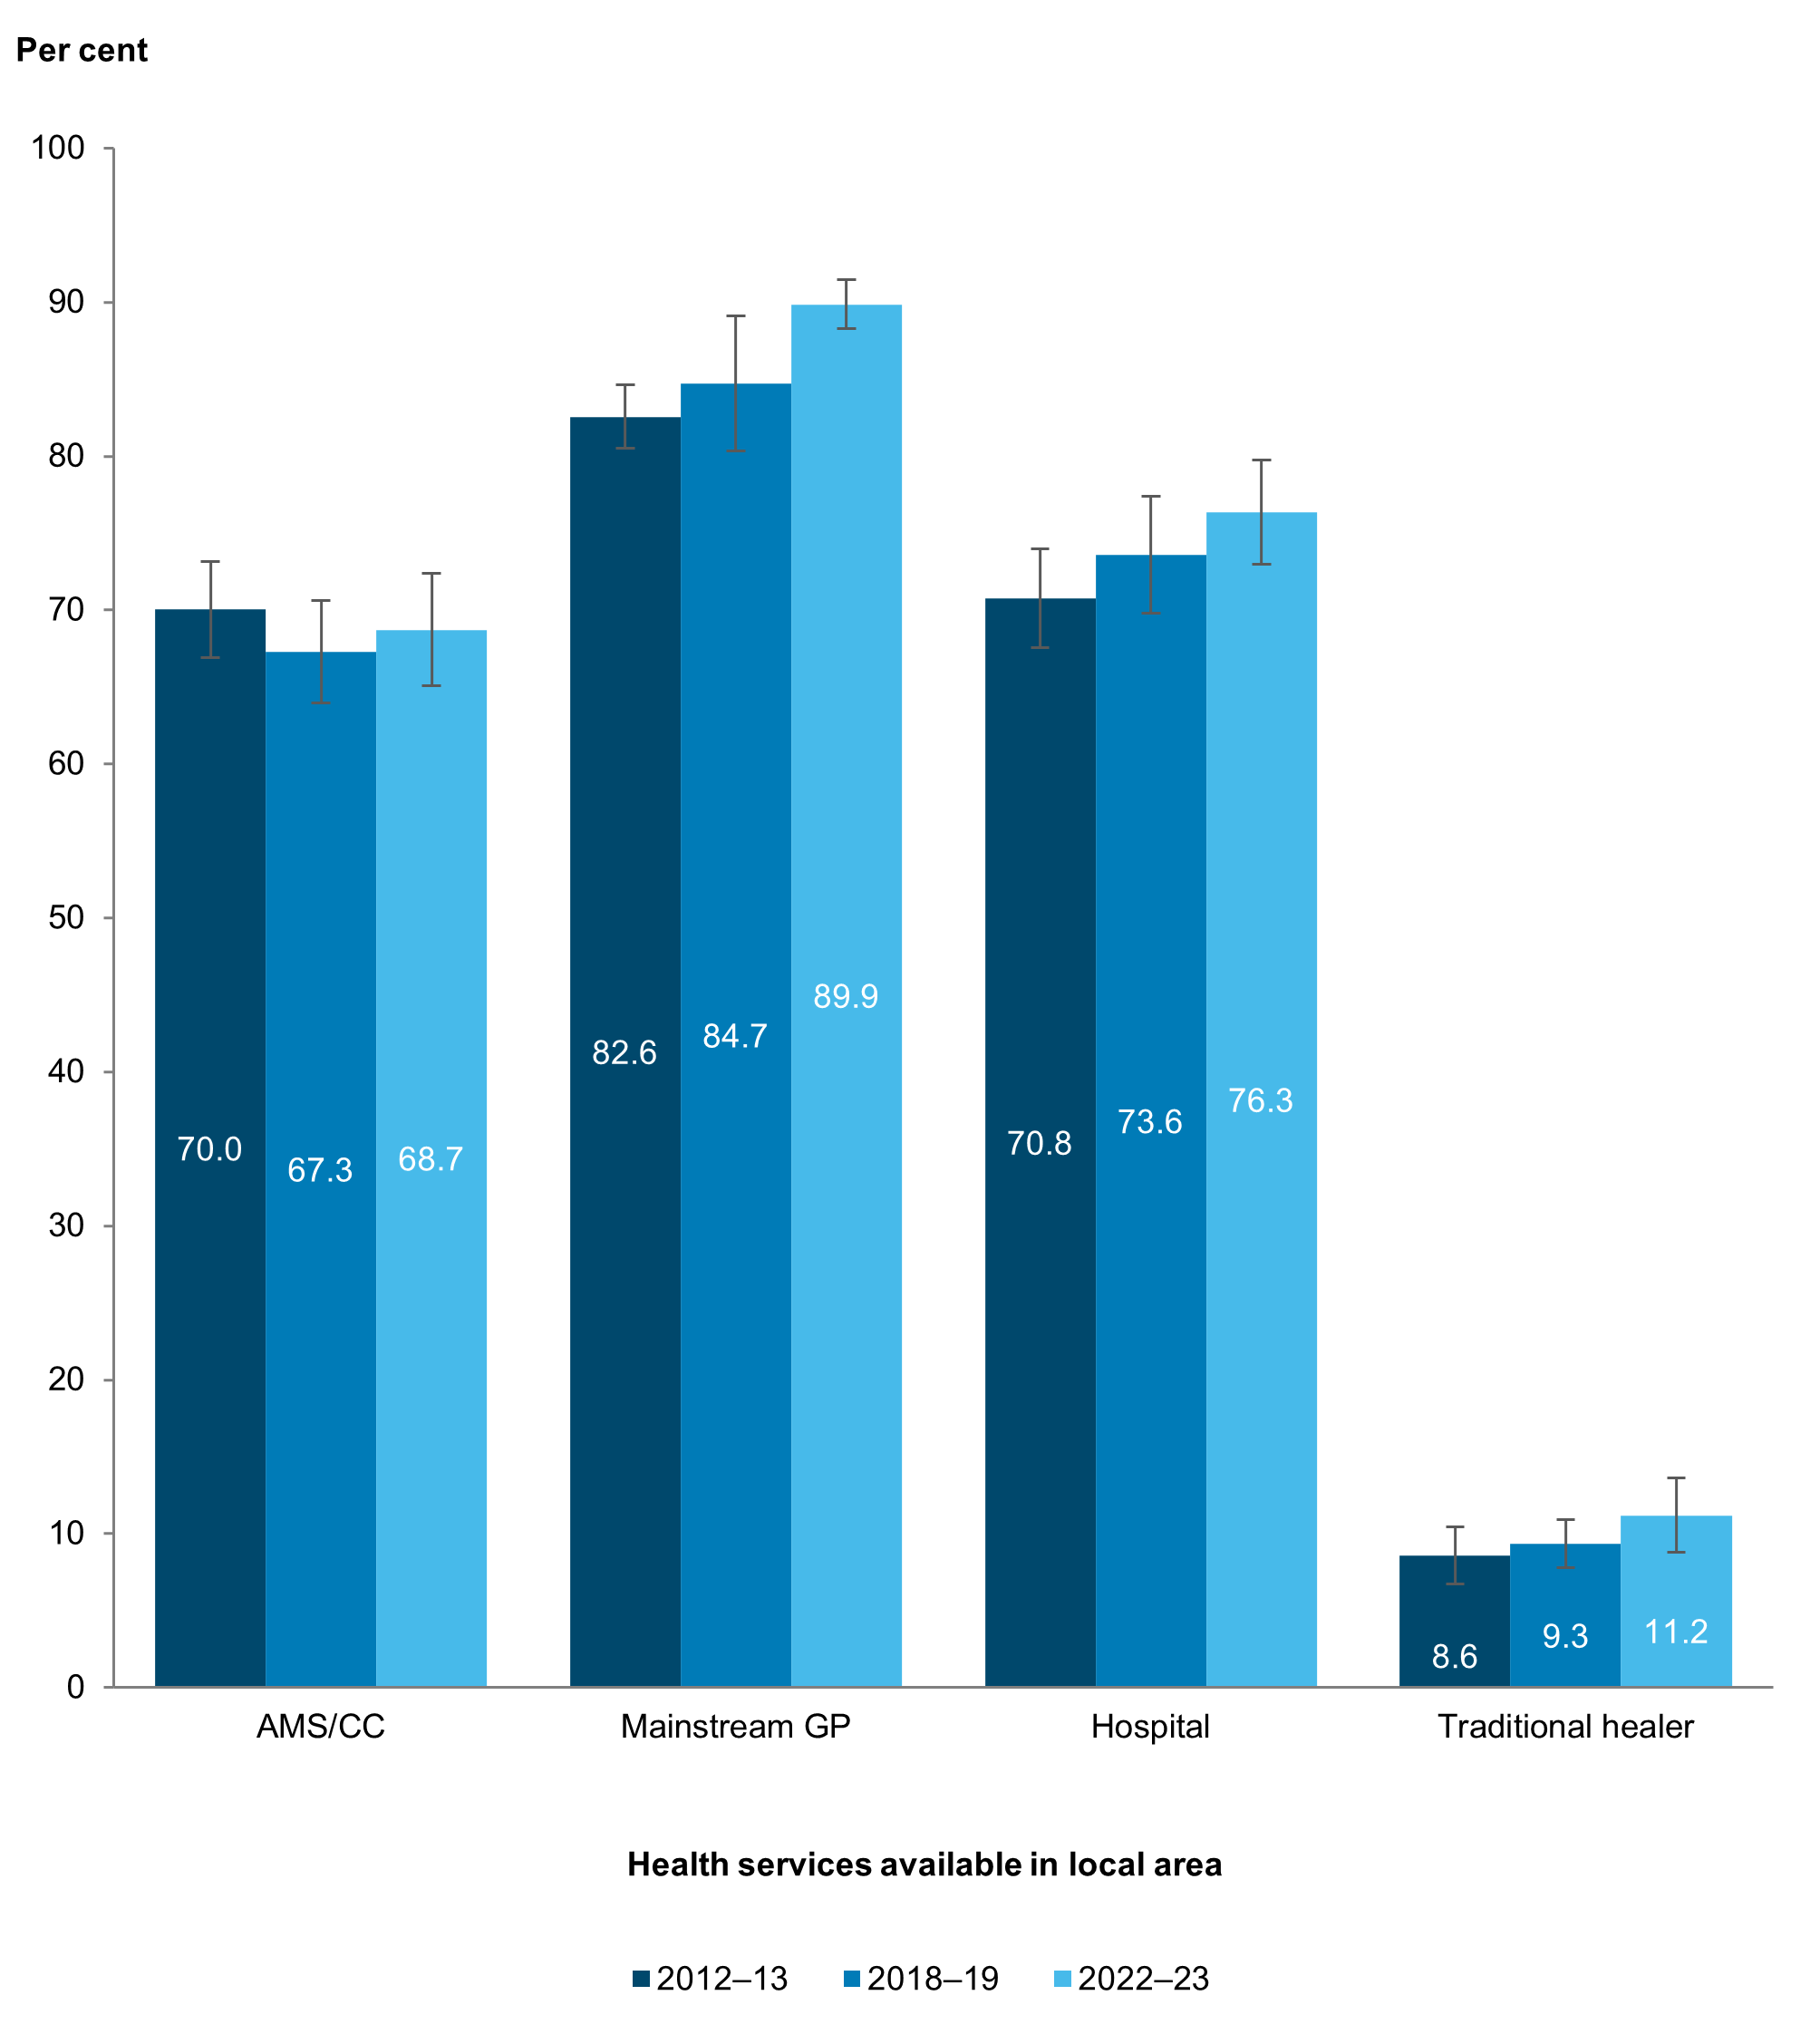
The estimated proportion of Aboriginal and Torres Strait Islander people with an AMS/CC in their local area changed little between 2018–19 and 2022–23 (Figure 3). However, the proportion with a mainstream GP was significantly higher in 2022–23 compared with 2012–13 and 2018–19.
Figure 3: Aboriginal and Torres Strait Islander people, type of health services available in their local area, by survey cycle
 Notes:
- Respondents were asked to tick all that were available.
- Because 3 additional service types were included in the list for children aged 0–14 in the 2022–23 NATSIHS, ‘other’ is not comparable to previous survey cycles and is excluded from this figure. Data for ‘none’ is also excluded because the estimates had a relative standard error between 25% and 50% and should be used with caution.
- Data are population weighted estimates.
- While non-overlapping confidence intervals (CIs) generally indicate statistical significance, overlapping CIs do not necessarily imply that a difference is not significant. See Technical notes for more information.
Source: AIHW analysis of 2012–13, 2018–19, and 2022–23 NATSIHS using TableBuilder (ABS 2013, 2019, 2025).