Unmet need
National Aboriginal and Torres Strait Islander Health Survey (NATSIHS) respondents were asked whether there was ever a time during the last 12 months where they (or their child) needed dental care but did not get it. If there had been an occasion of unmet need, they were given a list of 13 potential reasons why they did not go and were asked to tick as many as applied.
In 2022–23, of the estimated 946,000 Aboriginal and Torres Strait Islander people aged 2 and over:
- 201,500 (21%) had at least one instance in the last 12 months when they needed dental care but did not get it (had an unmet need)
- 745,300 (79%) had no unmet need for dental care.
Among Aboriginal and Torres Strait Islander people aged 2 and over who always used the same source of health care, unmet need for dental care was similar among those whose usual source was a mainstream GP (20% or an estimated 106,000 of 515,000) and those whose usual source was an AMS/CC (21% or 49,600 of 239,000).
Although the levels of unmet need for dental care among Aboriginal and Torres Strait Islander people aged 2 and over were higher than those for GP care, the patterns were generally similar (Figure 26):
- The proportion of those with unmet need was similar among Major cities, Inner regional, Outer regional and Remote areas (21–22%), and was slightly lower in Very remote areas (16% or an estimated 14,400 of 87,400). Major cities had the highest estimated number of people with unmet need (83,000).
- Young children (aged 5–14) had low rates (6.6% or an estimated 14,300 of 216,000) of unmet need for dental care (which may be related to targeted children’s dental programs), while the proportion was higher in those aged 15–34 (27% or 89,500 of 333,000) and 35–54 (34% or 68,500 of 200,000). The highest estimated number of Aboriginal and Torres Strait Islander people with an unmet need were in the 15–34 age group (89,500).
- There were 93,800 Aboriginal and Torres Strait Islander people aged 2 and over living in the most disadvantaged areas with unmet need.
- Those aged 18 and over who had experienced unfair treatment in the last year had a higher rate of unmet need (39% or an estimated 53,700 of 137,000) than those who had not experienced unfair treatment (27% or 111,000 of 416,000).
- Those with disability had a higher rate of unmet need (29% or an estimated 108,000 of 366,000) than those without disability (16% or 93,000 of 580,000).
The following data visualisation shows the distribution of whether Aboriginal and Torres Strait Islander people had an unmet need for dental care, by remoteness, state/territory, age group, SEIFA quintile, whether they experienced any form of unfair treatment in the last 12 months, and disability status.
Figure 26: Whether Aboriginal and Torres Strait Islander people had an unmet need for dental care in the last 12 months, by selected categories and survey cycle
Bar chart shows that in 2022–23, 84% of Aboriginal and Torres Strait Islander people aged 2 and over in Very remote areas did not have an unmet for a dentist in the last 12 months, compared with 77% in Inner regional areas.
Notes:
- Data are population weighted estimates.
- While non-overlapping confidence intervals (CIs) generally indicate statistical significance, overlapping CIs do not necessarily imply that a difference is not significant. See Technical notes for more information.
- The upper bounds for some CIs were truncated at 100%. For the untruncated bounds, see Data.
Source: AIHW analysis of 2012–13, 2018–19 and 2022–23 NATSIHS using TableBuilder (ABS 2013, 2019, 2025).
Reasons for unmet need
In 2022–23, by far the most common reason for unmet need for dental care among Aboriginal and Torres Strait Islander people aged 2 and over was cost – 45% (or an estimated 91,600 of 202,000) (Figure 27).
Figure 27: Aboriginal and Torres Strait Islander people aged 2 and over, reasons for unmet need for dental care in the last 12 months, 2022–23
Bar chart shows that in 2022–23, for 24% of (or an estimated 47,400) Aboriginal and Torres Strait Islander people aged 2 and over the reason for their unmet need for dental care in the last 12 months was that they were too busy.
| Reason for unmet need for dental care | Number |
|---|---|
| Cost | 91,600 |
| Too busy (including work, personal, family responsibilities) | 47,400 |
| Dislikes (service/professional, afraid, embarrassed) | 45,600 |
| Waiting time too long or not available at time required | 41,500 |
| Decided not to seek care | 23,000 |
| Transport/distance | 21,400 |
| Not available in area | 16,100 |
| Did not trust this health service provider | 15,900 |
| Other | 13,300 |
| Reason for unmet need for dental care | Per cent |
|---|---|
| Cost | 45.5 |
| Too busy (including work, personal, family responsibilities) | 23.5 |
| Dislikes (service/professional, afraid, embarrassed) | 22.6 |
| Waiting time too long or not available at time required | 20.6 |
| Decided not to seek care | 11.4 |
| Transport/distance | 10.6 |
| Not available in area | 8.0 |
| Did not trust this health service provider | 7.9 |
| Other | 6.6 |
Notes:
- The percentage distribution is calculated only on those who had at least one occasion of unmet need in the last 12 months.
- Only reasons with an acceptable standard error were included.
- Respondents were allowed to select multiple responses.
- Data are population weighted estimates.
Source: AIHW analysis of 2022–23 NATSIHS using TableBuilder (ABS 2025).
In 2022–23, of the estimated 91,600 Aboriginal and Torres Strait Islander people aged 2 and over who had unmet need for dental care because of cost:
- 60,200 (66%) usually went to a mainstream GP
- 53,500 (58%) were female
- 50,900 (56%) had disability
- 39,900 (44%) lived in Major cities
- 39,400 (43%) were in the most disadvantaged areas (1st SEIFA quintile).
The reasons for unmet need for dental care differ from that for GPs with respect to the number and proportion who disliked the service/professional or were afraid or embarrassed – 23% of those aged 2 and over (or an estimated 45,600 of 202,000) compared with 8.4% (13,300 of 159,000) for GPs. Understanding this fear and embarrassment is essential to overcome barriers to dental care, even when it is available.
Looking at whether the reasons for unmet need for dental care differed by the usual source of health care (AMS/CC and mainstream GPs only) shows that cost was much less of a barrier for those using an AMS/CC (28% or an estimated 15,000 of 53,300) than for those using a mainstream GP (52% or 60,200 of 116,000), while waiting time being too long or the service not being available at the time required was much less of a barrier for those using a mainstream GP (16% or 18,500 of 116,000) than those using an AMS/CC (31% or 16,300 of 53,300) (Table 7).
Reason for unmet need | AMS/CC | Mainstream GP |
|---|---|---|
Cost | 28.1 | 52.1 |
Too busy (including work, personal, family responsibilities) | 24.2 | 23.9 |
Dislikes (service/professional, afraid, embarrassed) | 24.4 | 20.8 |
Waiting time too long or not available at time required | 30.6 | 16.0 |
Decided not to seek care | 9.9* | 11.2 |
Estimated total with unmet need | 53,300 | 116,000 |
* Estimate has a relative standard error between 25% and 50% and should be used with caution.
Note: Data are population weighted estimates.
Source: AIHW analysis of 2022–23 NATSIHS using TableBuilder (ABS 2025).
Comparisons across survey cycles
Cost has remained the primary reason for unmet need for dental care for Aboriginal and Torres Strait Islander aged 2 and over across the 3 survey cycles, ranging from 43% in 2012–13, to 42% in 2018–19, to 45% in 2022–23 (Figure 28). However, while there appear to have been some changes in these and other proportions across cycles, these differences may fall within the margin of sampling error and should be interpreted with caution.
Figure 28: Aboriginal and Torres Strait Islander people aged 2 and over, selected reasons had unmet need for dental care, by survey cycle
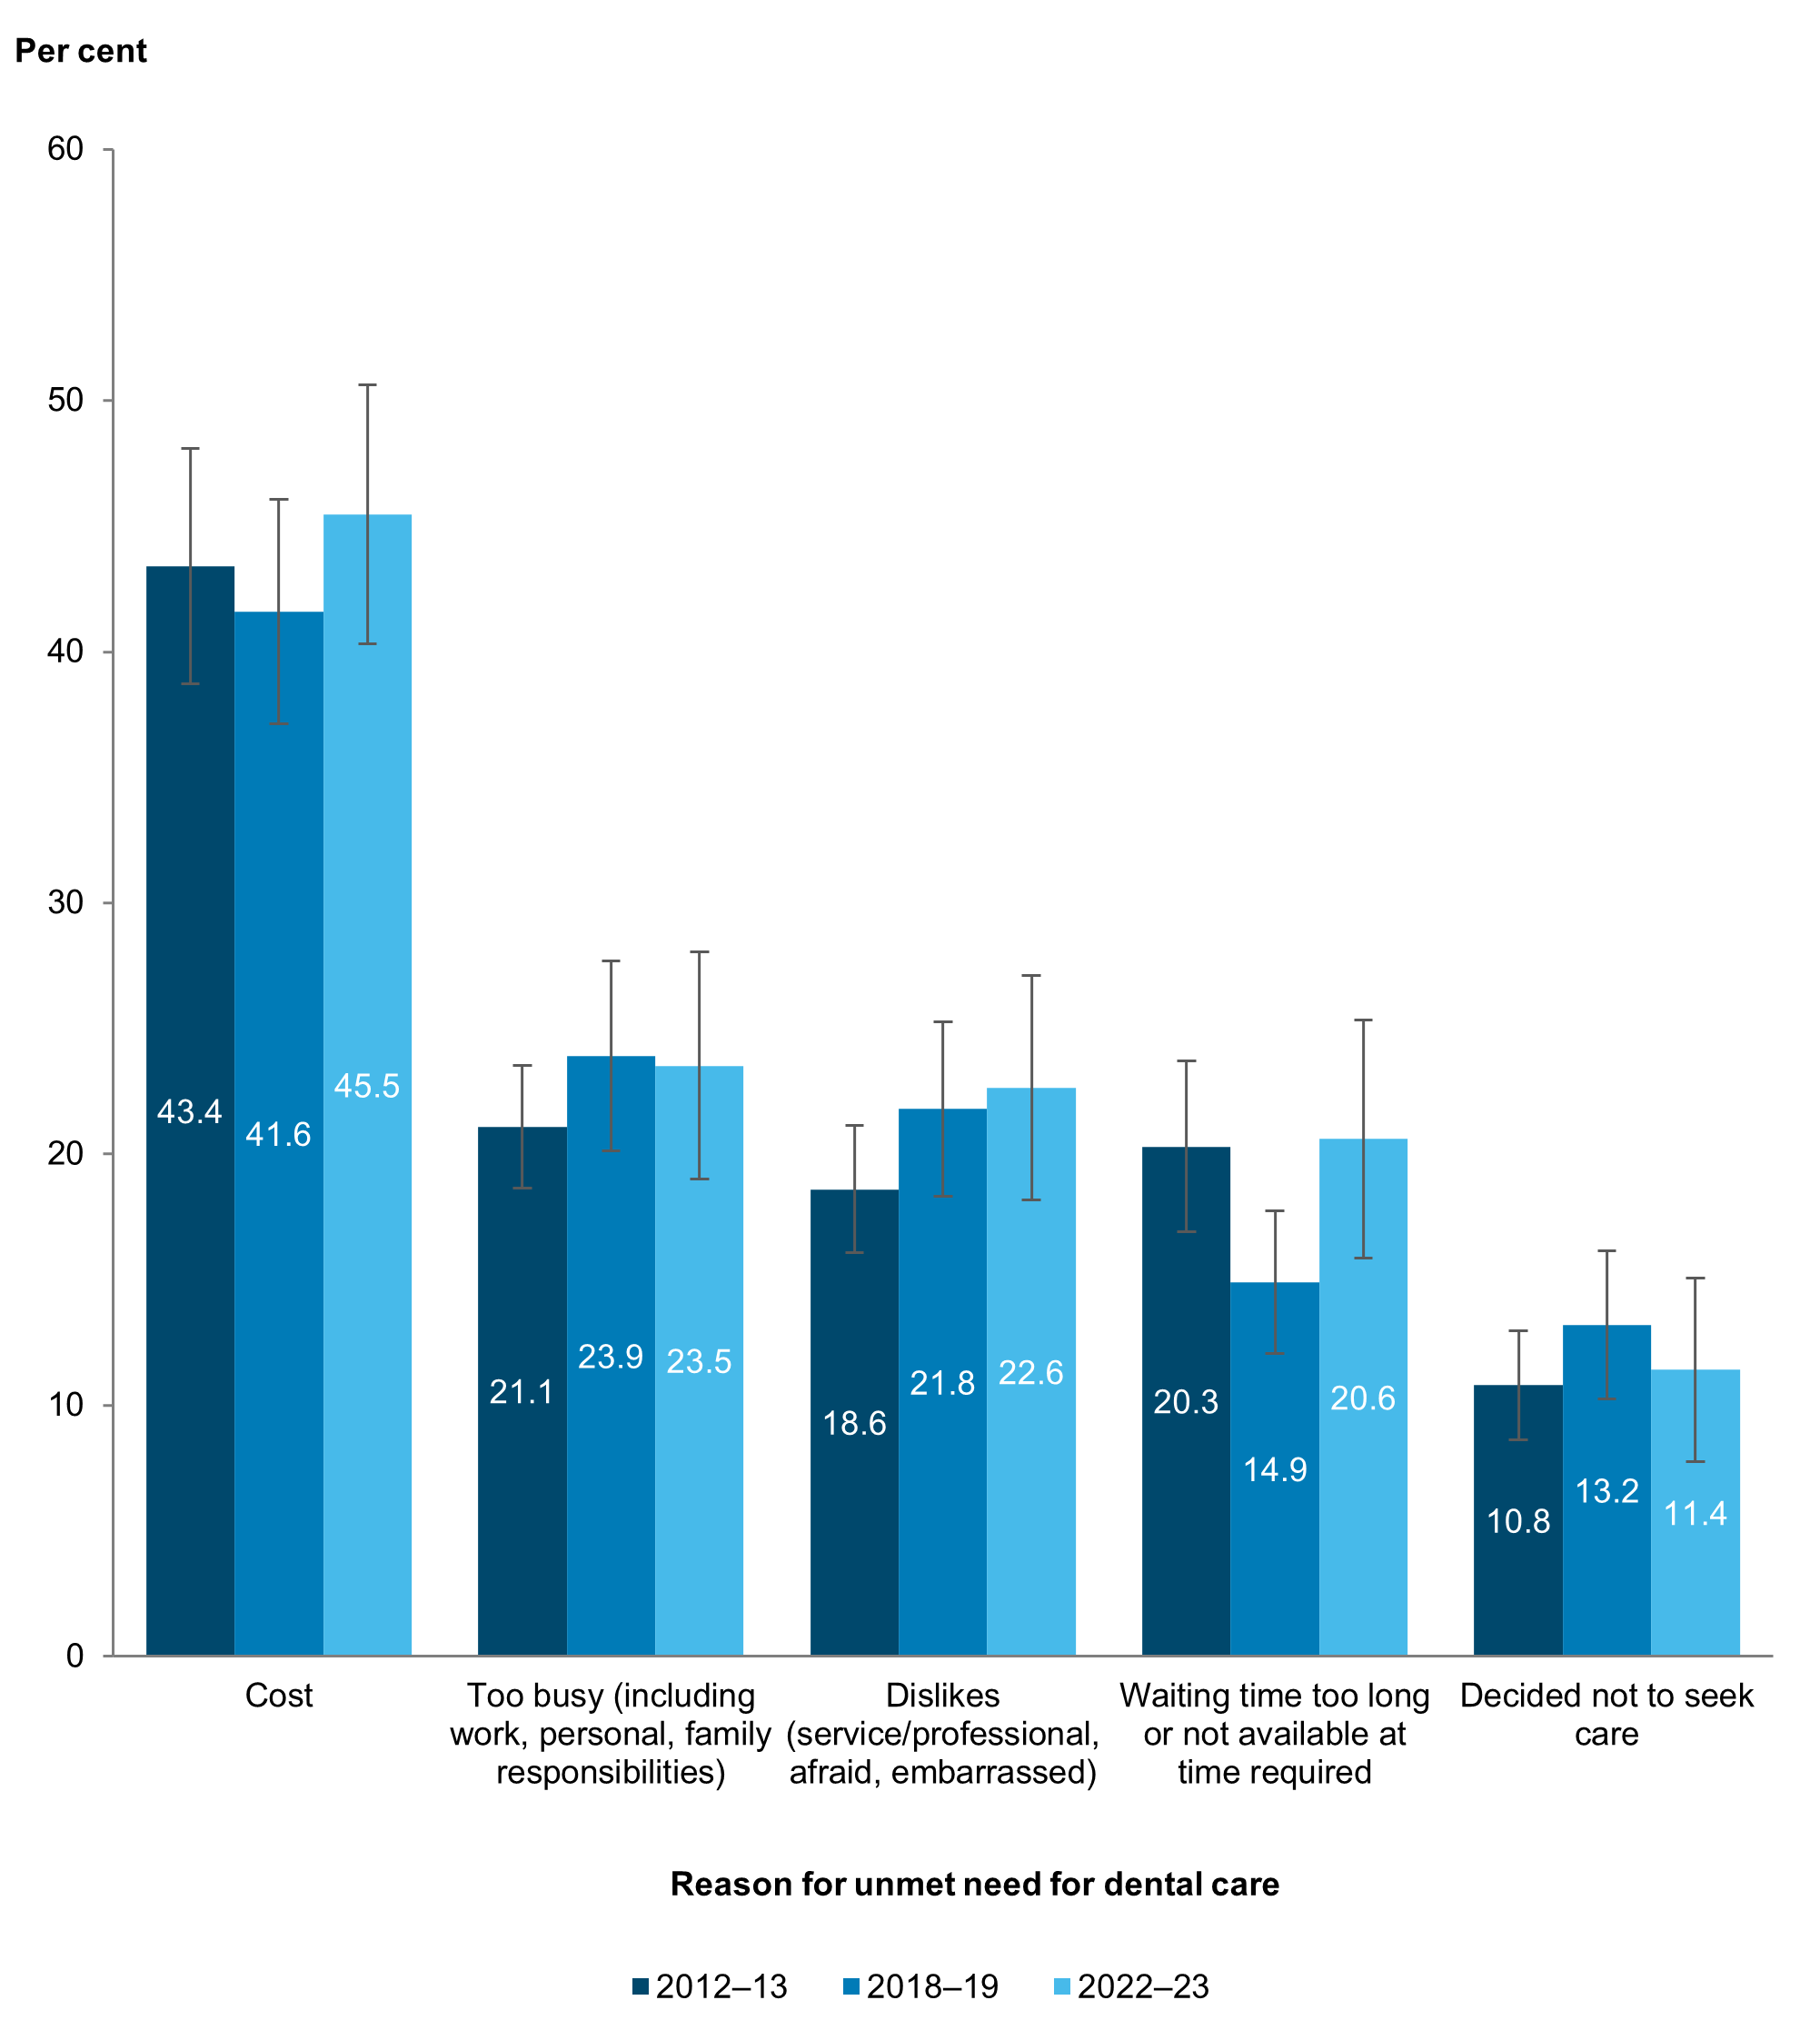
Notes:
- Data are population weighted estimates.
- While non-overlapping confidence intervals (CIs) generally indicate statistical significance, overlapping CIs do not necessarily imply that a difference is not significant. See Technical notes for more information.
Source: AIHW analysis of 2012–13, 2018–19 and 2022–23 NATSIHS using TableBuilder (ABS 2013, 2019, 2025).
ABS (Australian Bureau of Statistics) (2013) National Aboriginal and Torres Strait Islander Health Survey, 2012–13: TableBuilder [TableBuilder], ABS, Australian Government, accessed 3 February 2025.
—— (2019) National Aboriginal and Torres Strait Islander Health Survey, 2018–19: TableBuilder [TableBuilder], ABS, Australian Government, accessed 3 February 2025.
—— (2025) National Aboriginal and Torres Strait Islander Health Survey, 2022–23: TableBuilder [TableBuilder], ABS, Australian Government, accessed 11 April 2025.