Comparisons across survey cycles
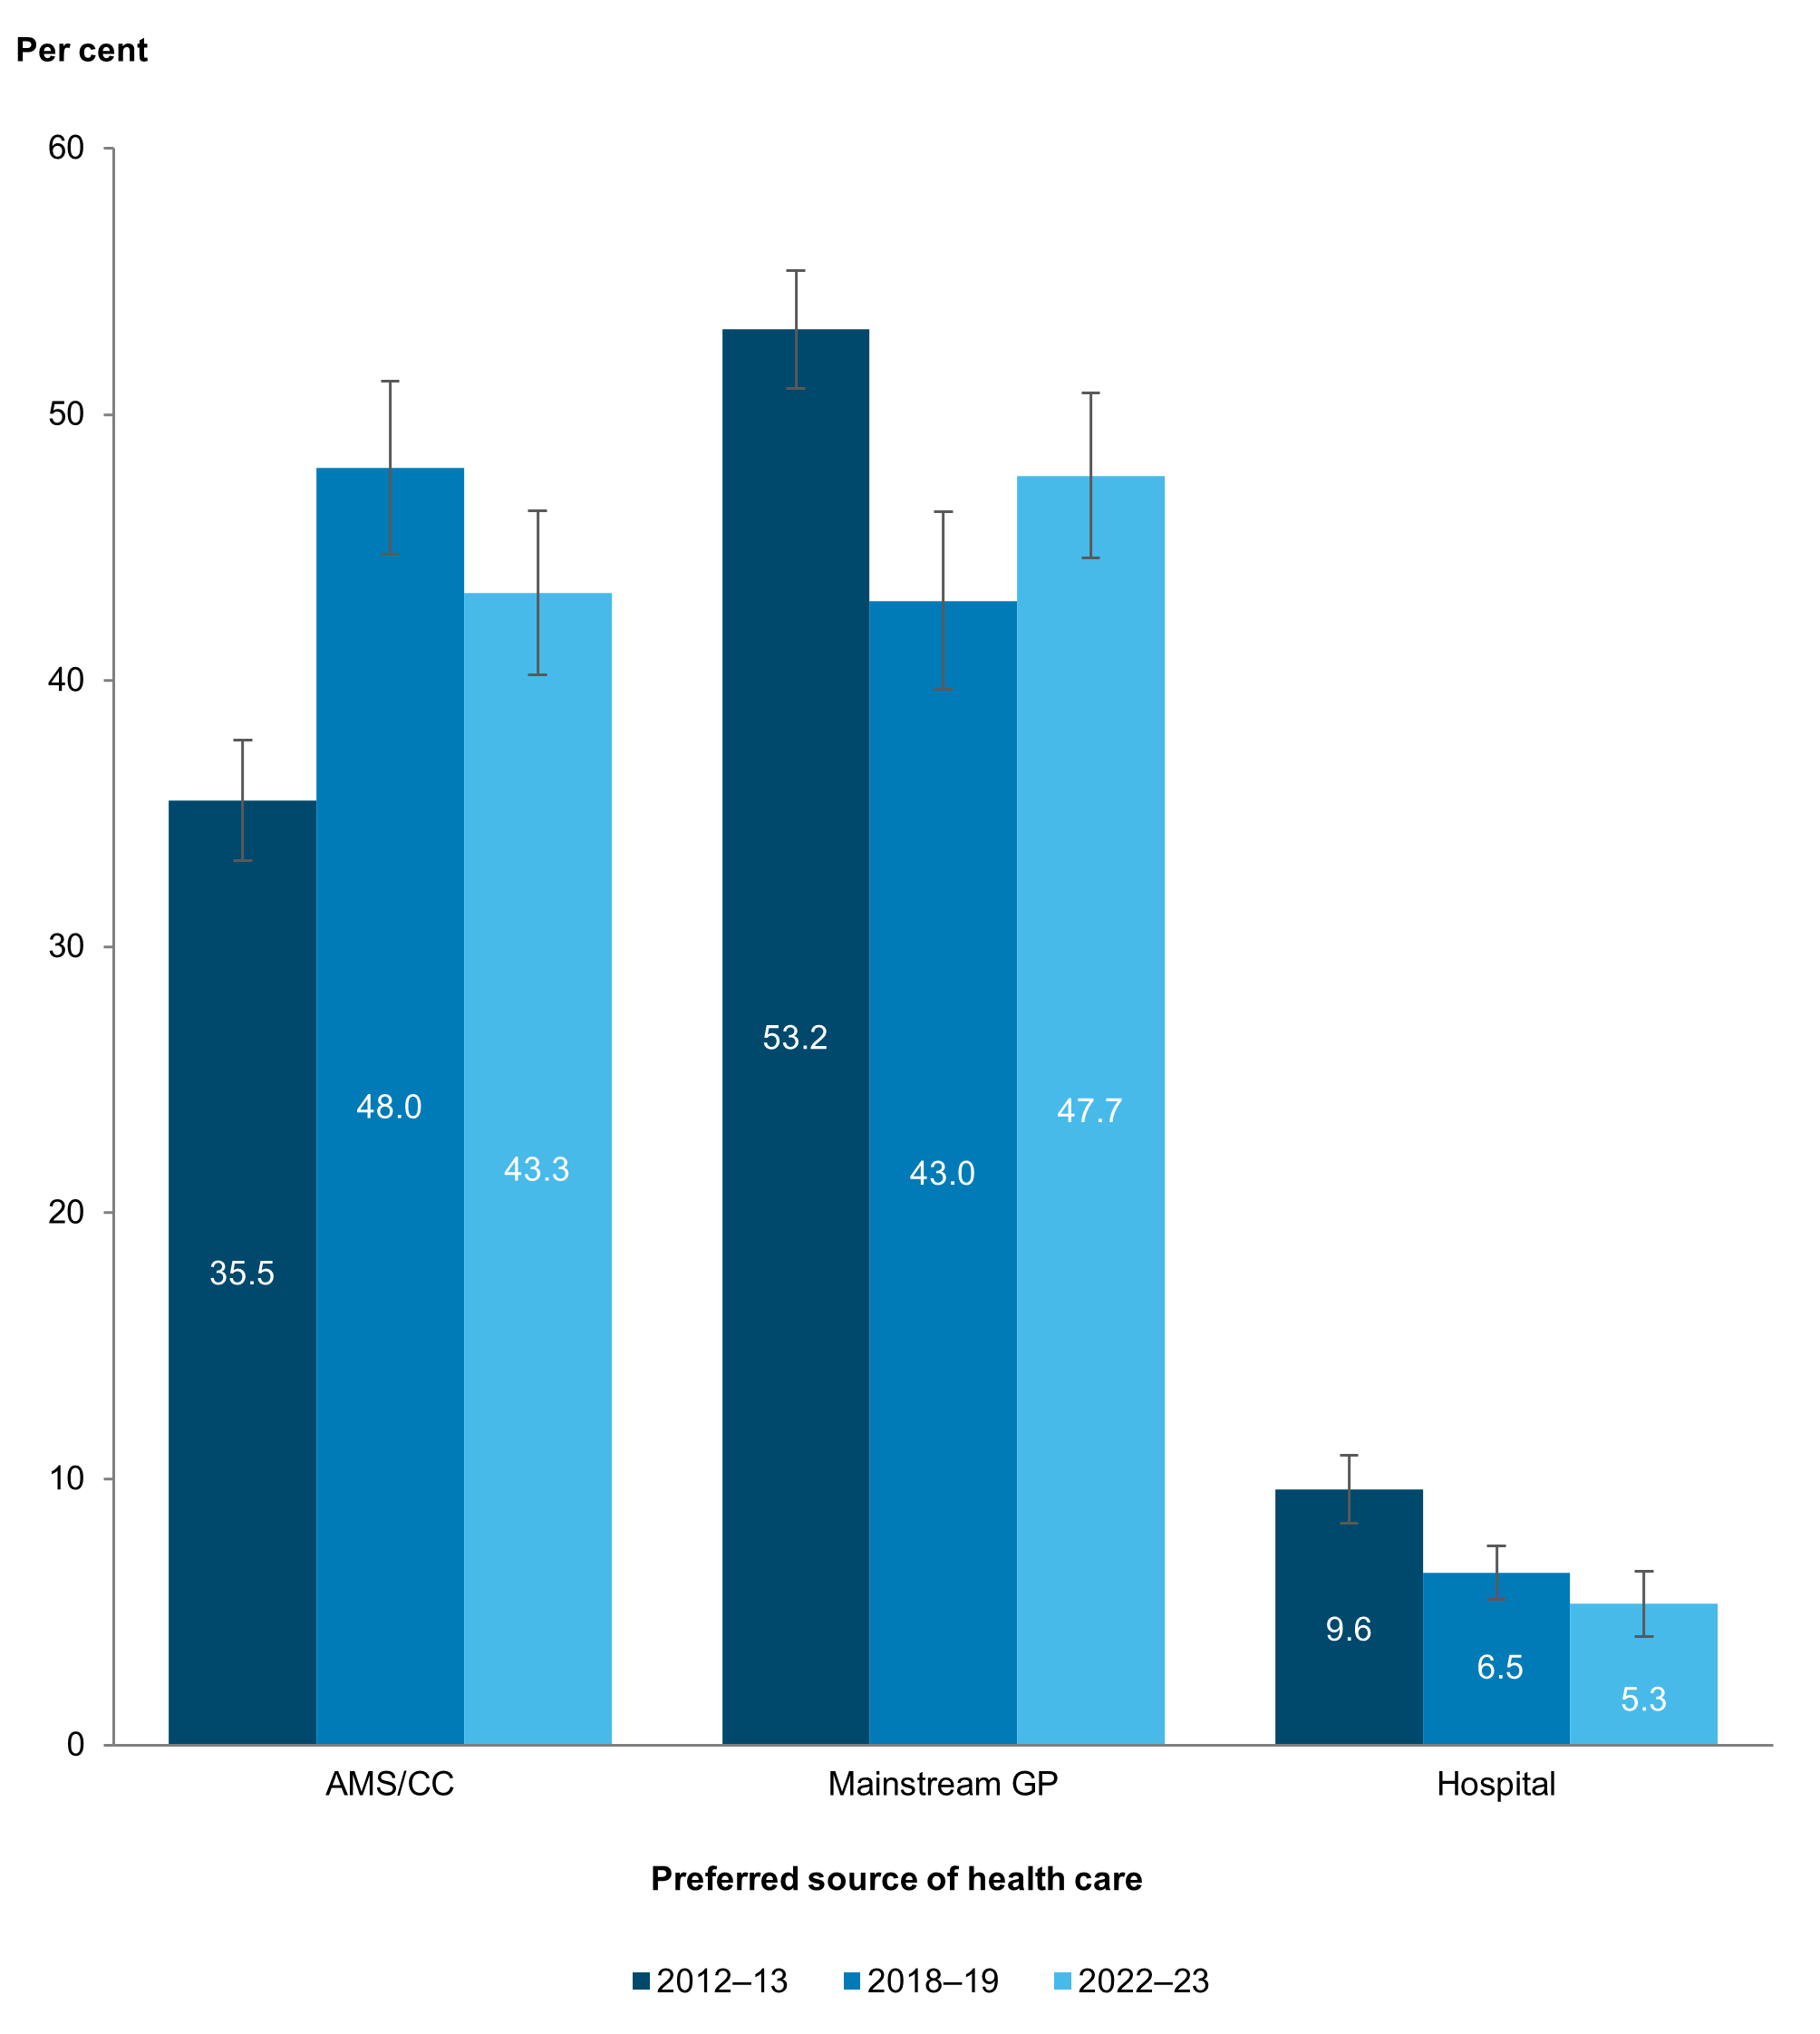
There was a significant difference in the distribution of preferences for health care in 2012–13 compared with 2018–19 and 2022–23 (Figure 8). Preference for an AMS/CC was generally higher in the later cycles, while preference for a mainstream GP or hospital was lower. However, the proportion who preferred an AMS/CC was significantly lower in 2022–23 compared with 2018–19, and the proportion who preferred a mainstream GP was significantly higher in 2022–23 compared with 2018–19.
Figure 8: Aboriginal and Torres Strait Islander people, preferred source of health care, by survey cycle
Notes:
- Data are population weighted estimates.
- While non-overlapping confidence intervals (CIs) generally indicate statistical significance, overlapping CIs do not necessarily imply that a difference is not significant. See Technical notes for more information.
Source: AIHW analysis of 2012–13, 2018–19 and 2022–23 NATSIHS using TableBuilder (ABS 2013, 2019, 2025).