Comparisons across survey cycles
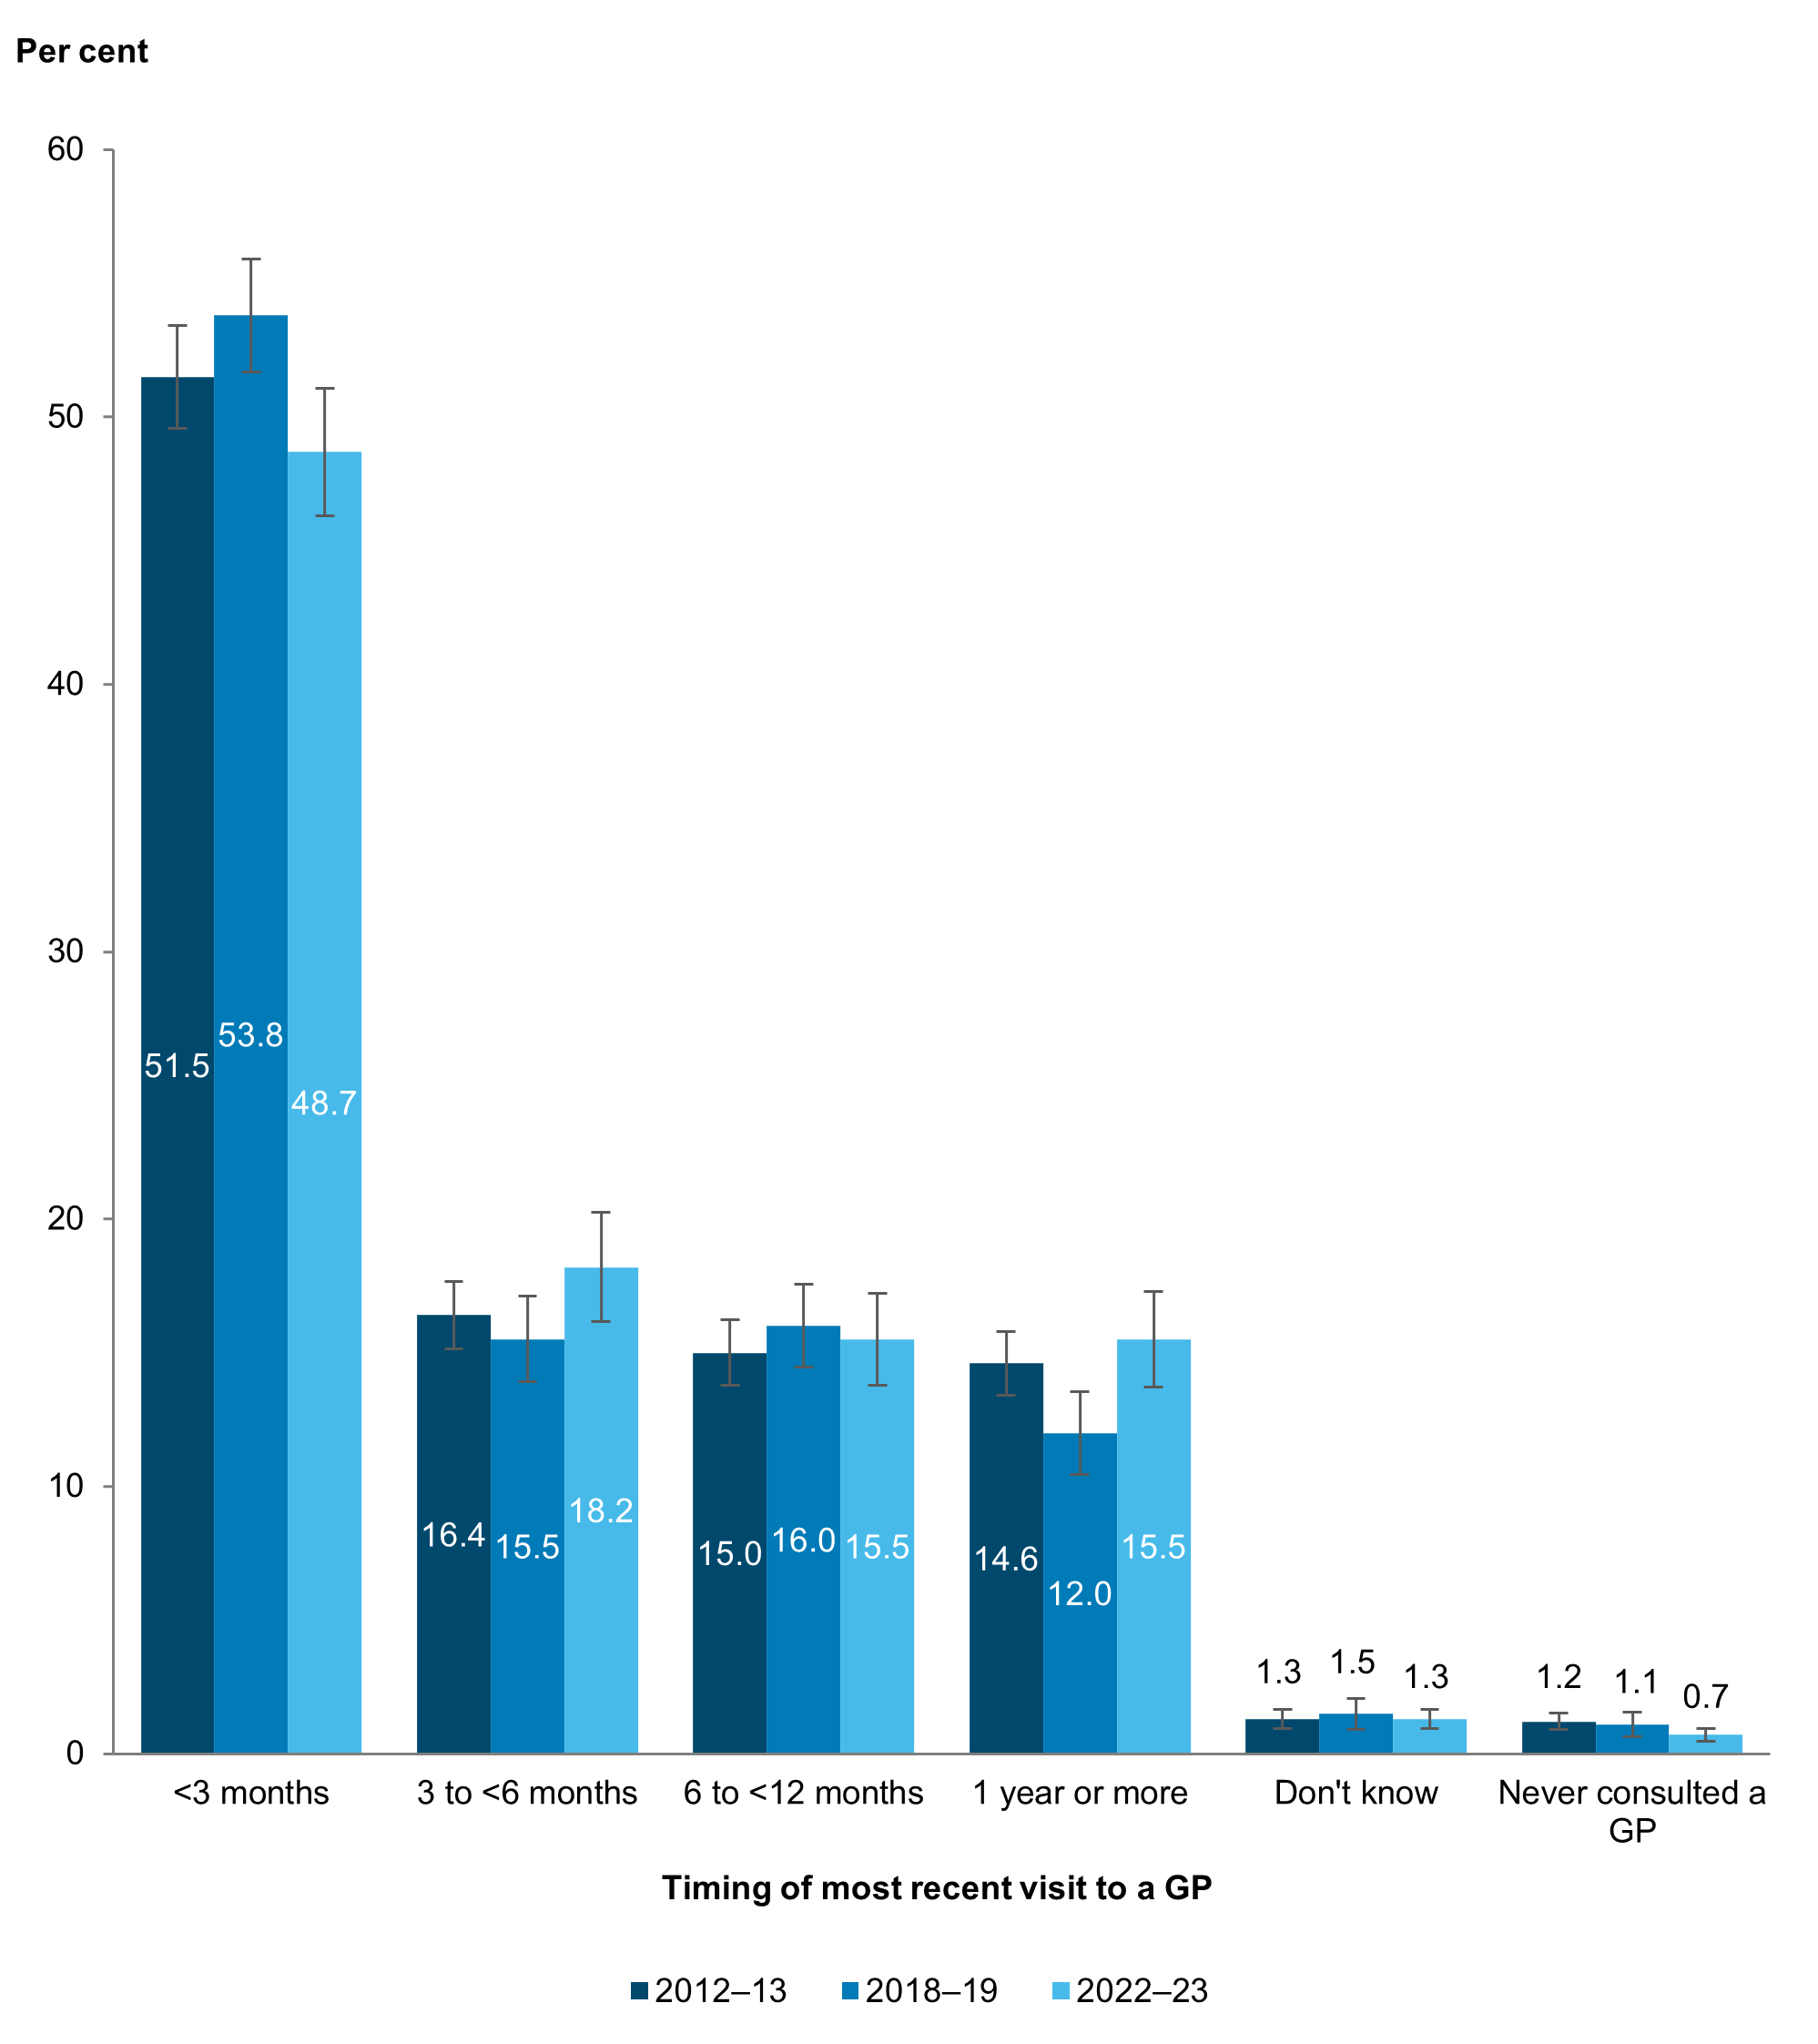
The distribution of Aboriginal and Torres Strait Islander people’s timing of their most recent visit to a GP has remained relatively stable across survey cycles (Figure 19). However, between 2018–19 and 2022–23, there was a significant:
- decrease in those who had seen a GP in the last 3 months – from 54% (or an estimated 427,000 of 793,000) to 49% (467,000 of 957,000)
- increase in those who had seen a GP in the last 3–<6 months – from 16% (123,000) to 18% (174,200)
- increase in those who had seen a GP 1 year or more ago – from 12% (or 95,500) to 15% (or 148,000).
Figure 19: Aboriginal and Torres Strait Islander people, most recent visit to a GP, by survey cycle
Notes:
- Data are population weighted estimates.
- While non-overlapping confidence intervals (CIs) generally indicate statistical significance, overlapping CIs do not necessarily imply that a difference is not significant. See Technical notes for more information.
Source: AIHW analysis of 2012–13, 2018–19 and 2022–23 NATSIHS using TableBuilder (ABS 2013, 2019, 2025).