Comparisons across survey cycles
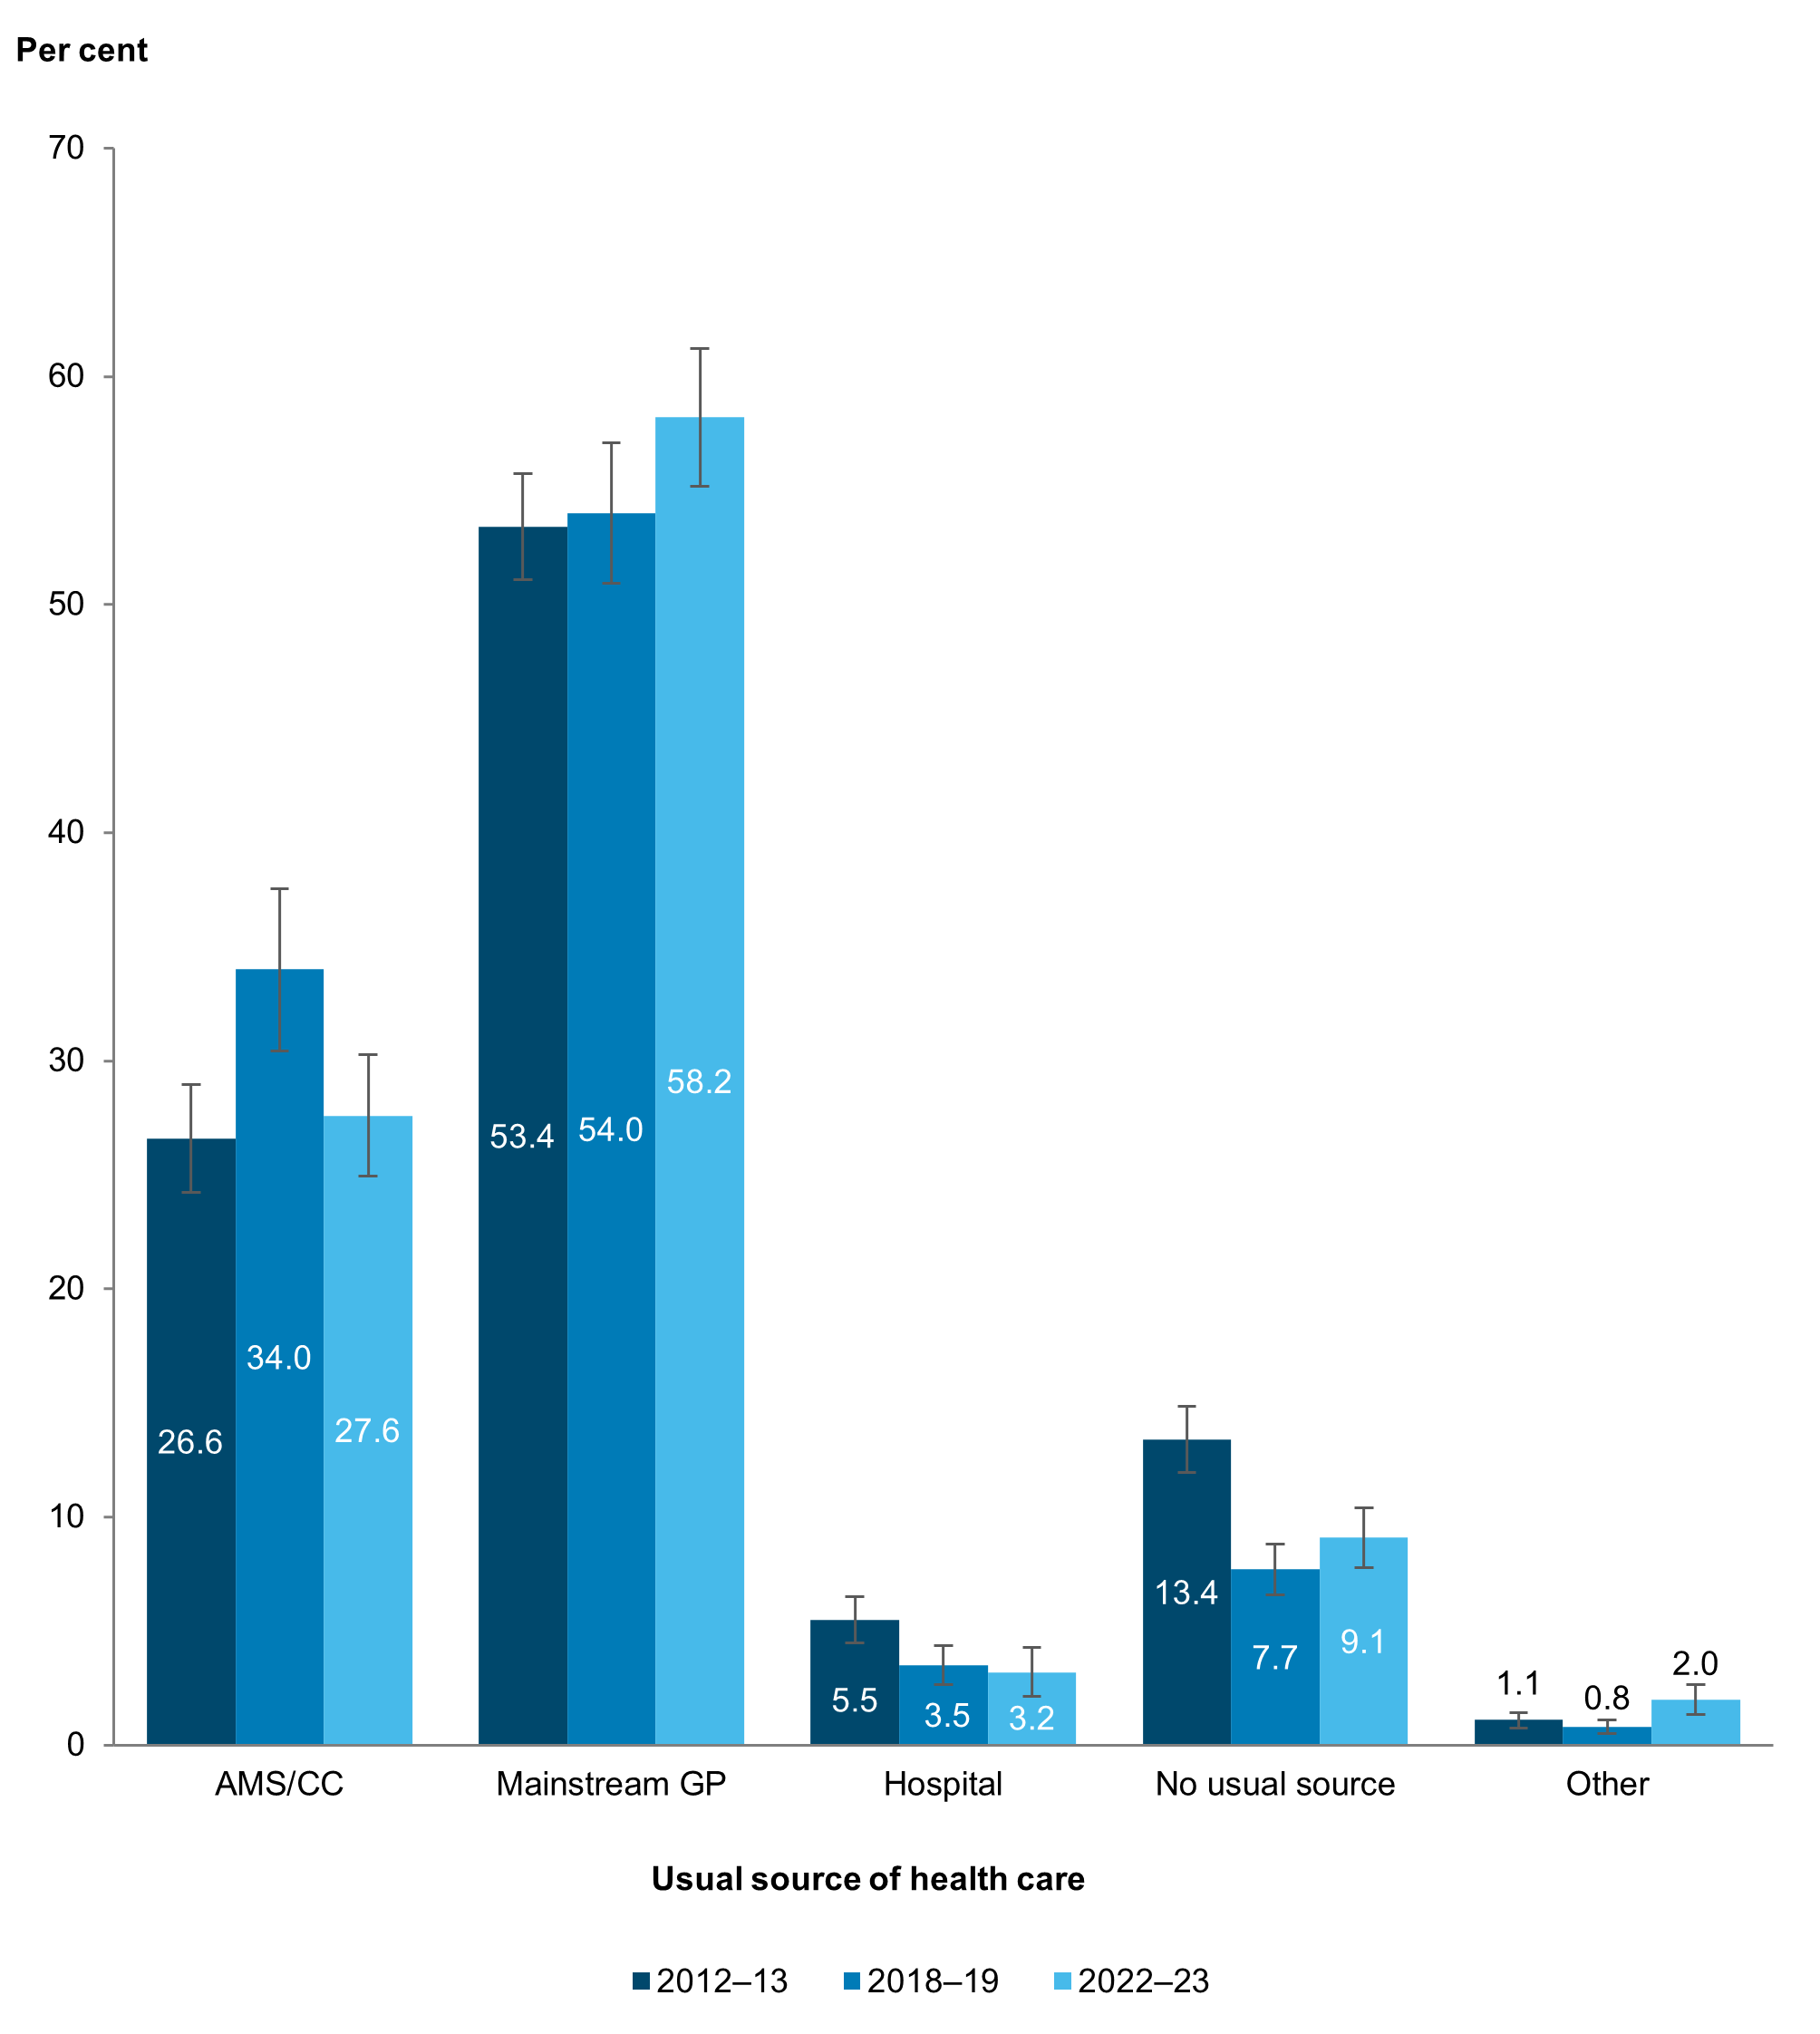
The proportion of Aboriginal and Torres Strait Islander people with an AMS/CC as their usual source of health care in 2018–19 was significantly higher than those in either the earlier or later cycles – increasing from 27% (or an estimated 170,000) in 2012–13 to 34% (277,000) in 2018–19 before decreasing in 2022–23 to 28% (274,000) (Figure 11).
The proportion who usually attended a mainstream General Practitioner (GP) was significantly higher in 2022–23 (58% or 579,000 of 994,000) compared with 2012–13 (53% or an estimated 341,000 of 638,000). There was no significant difference between 2018–19 (54% or 440,000 of 814,000) and 2022–23.
Figure 11: Usual source of health care among Aboriginal and Torres Strait Islander people, by survey cycle
Notes:
- Data are population weighted estimates.
- While non-overlapping confidence intervals (CIs) generally indicate statistical significance, overlapping CIs do not necessarily imply that a difference is not significant. See Technical notes for more information.
Source: AIHW analysis of 2012–13, 2018–19 and 2022–23 NATSIHS using TableBuilder (ABS 2013, 2019, 2025).
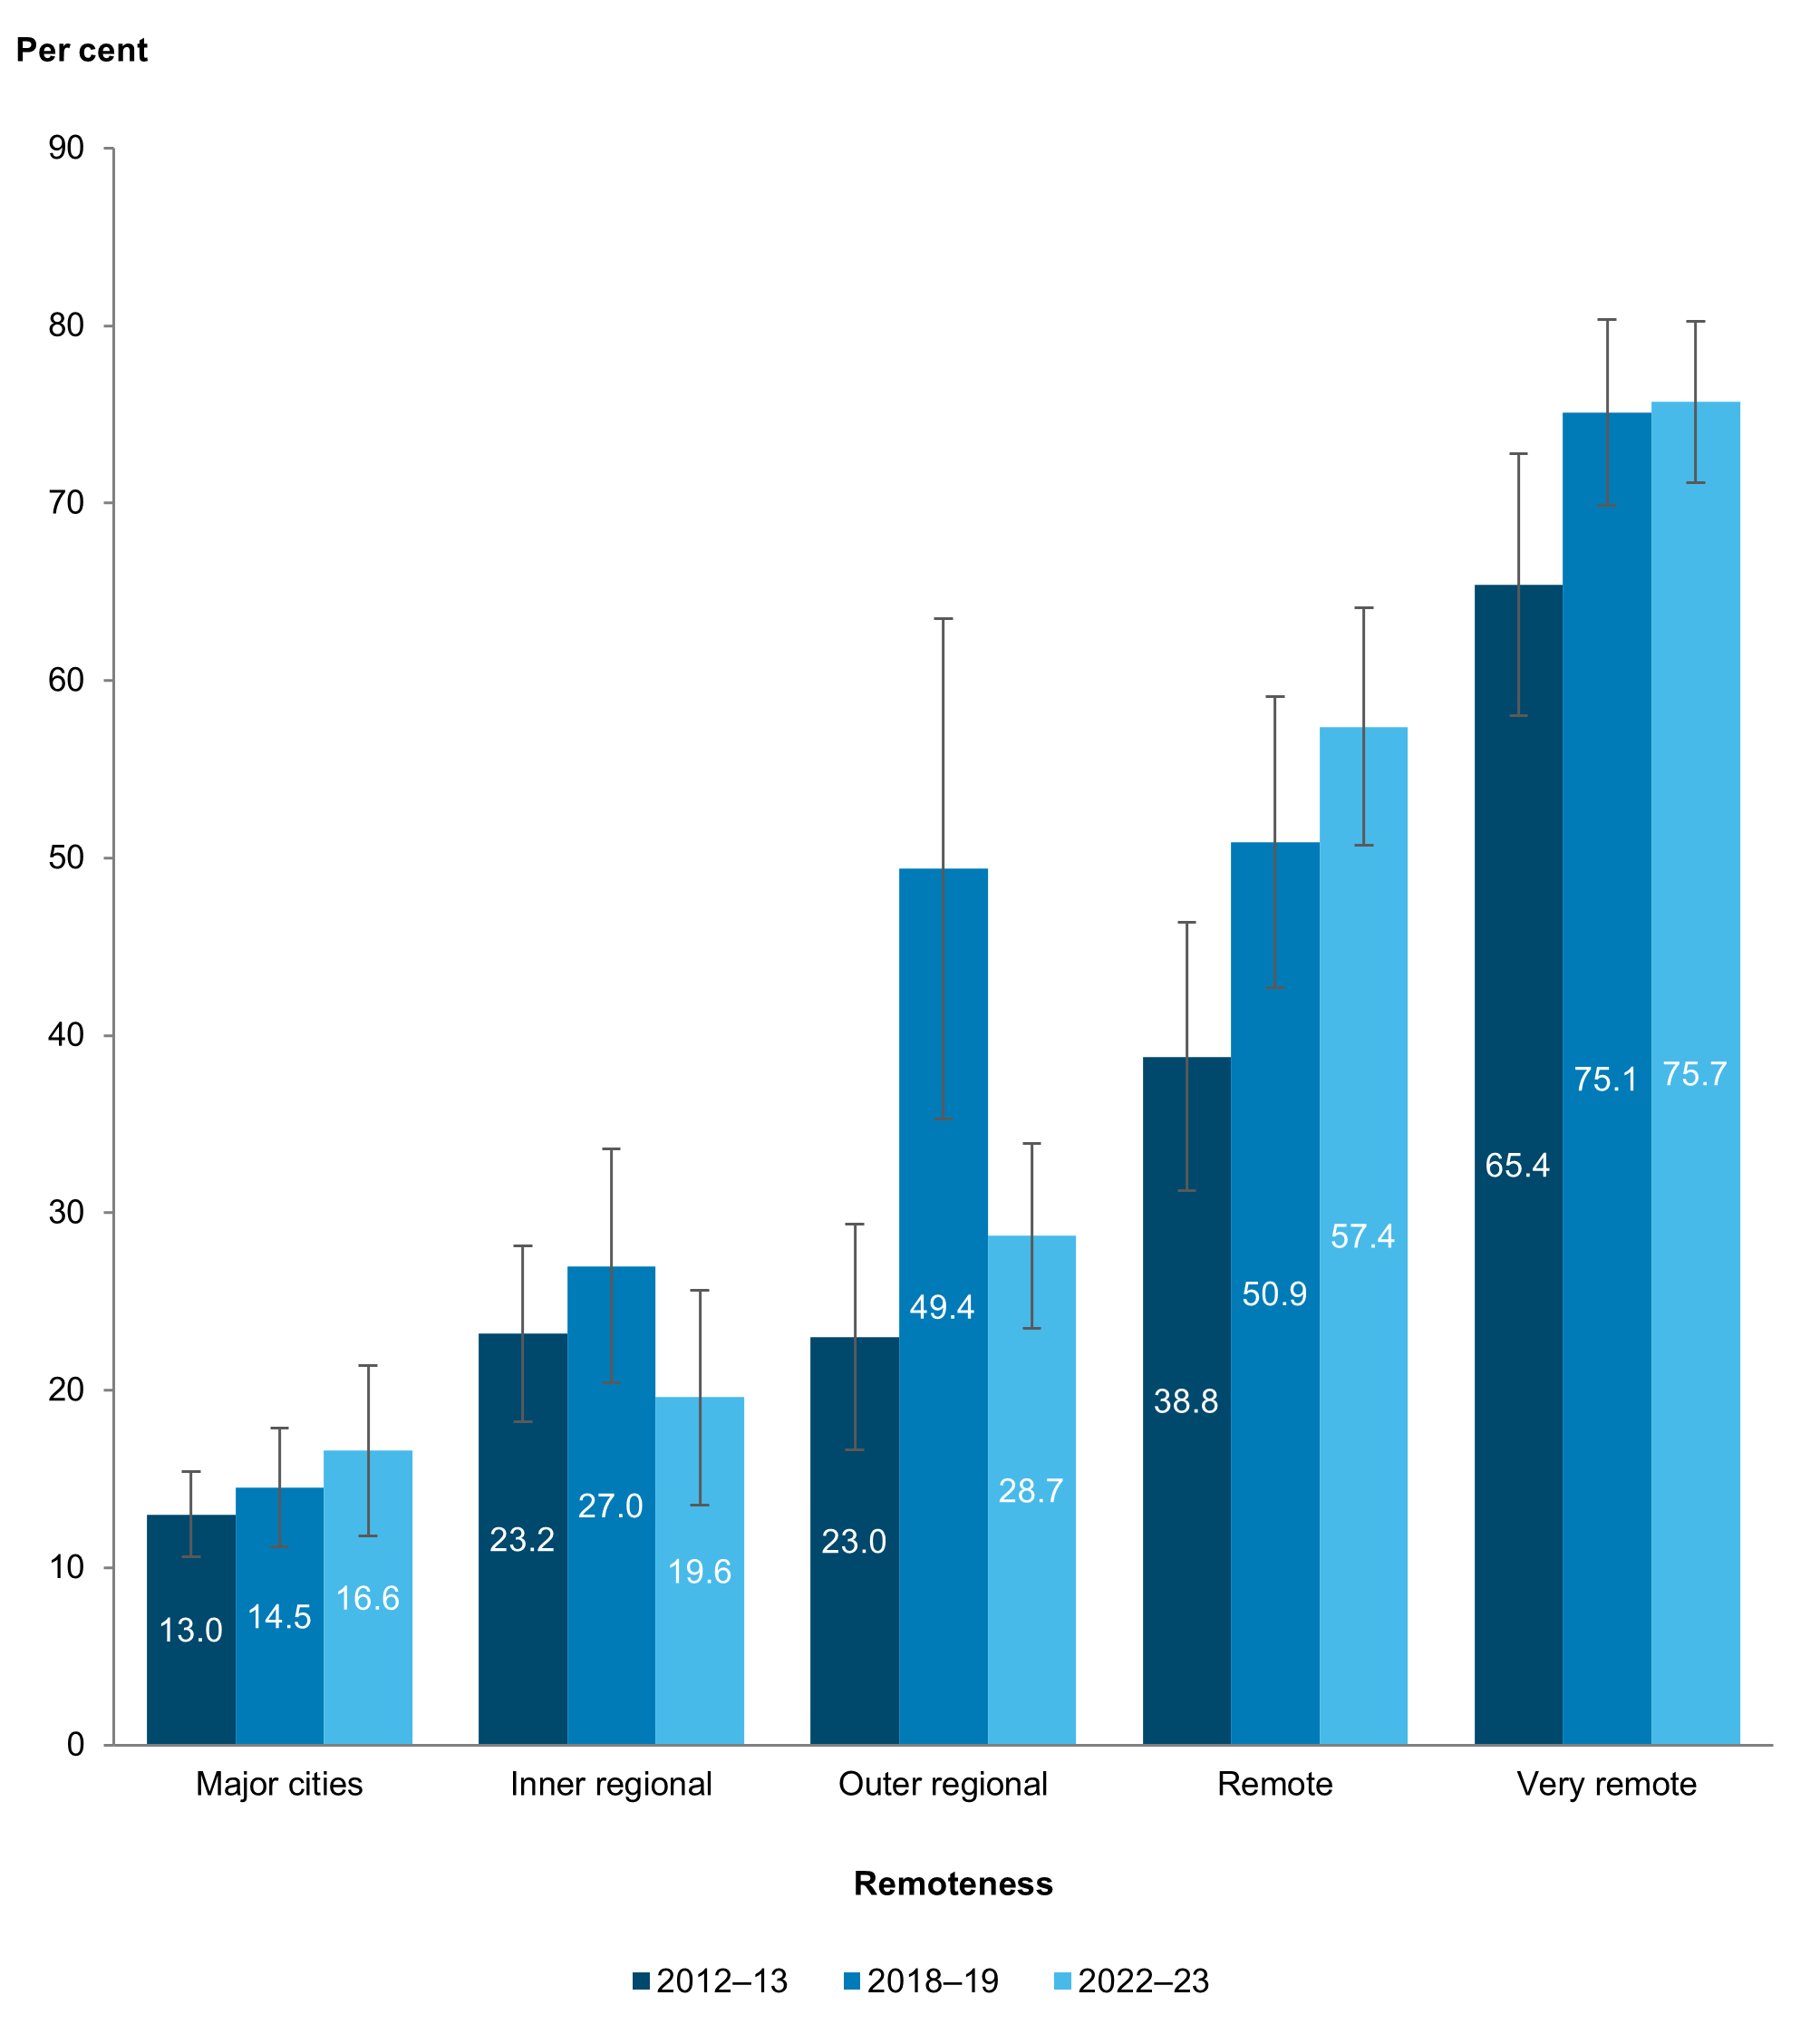
Figures 12 and 13 highlight the relationship between remoteness and having an AMS/CC and a mainstream GP, respectively, as a usual source of health care for each of the 3 survey cycles:
- in 2018–19, Outer regional areas were significantly different from those in the earlier and later survey cycles, with much higher proportions of Aboriginal and Torres Strait Islander people in those areas having an AMS/CC as their usual source and a much lower proportion having a mainstream GP as their usual source
- in Very Remote areas, the proportion with an AMS/CC was significantly higher in 2022–23 and 2018–19 compared with 2012–13
- in Remote areas, the proportion with an AMS/CC was significantly higher in 2022–23 and 2018–19 compared with 2012–13.
Figure 12: Aboriginal and Torres Strait Islander people who usually attended an AMS/CC, by remoteness and survey cycle
Notes:
- Data are population weighted estimates.
- While non-overlapping confidence intervals (CIs) generally indicate statistical significance, overlapping CIs do not necessarily imply that a difference is not significant. See Technical notes for more information.
Source: AIHW analysis of 2012–13, 2018–19, and 2022–23 NATSIHS using TableBuilder (ABS 2013, 2019, 2025).
Figure 13: Aboriginal and Torres Strait Islander people who usually attended a mainstream GP, by remoteness and survey cycle
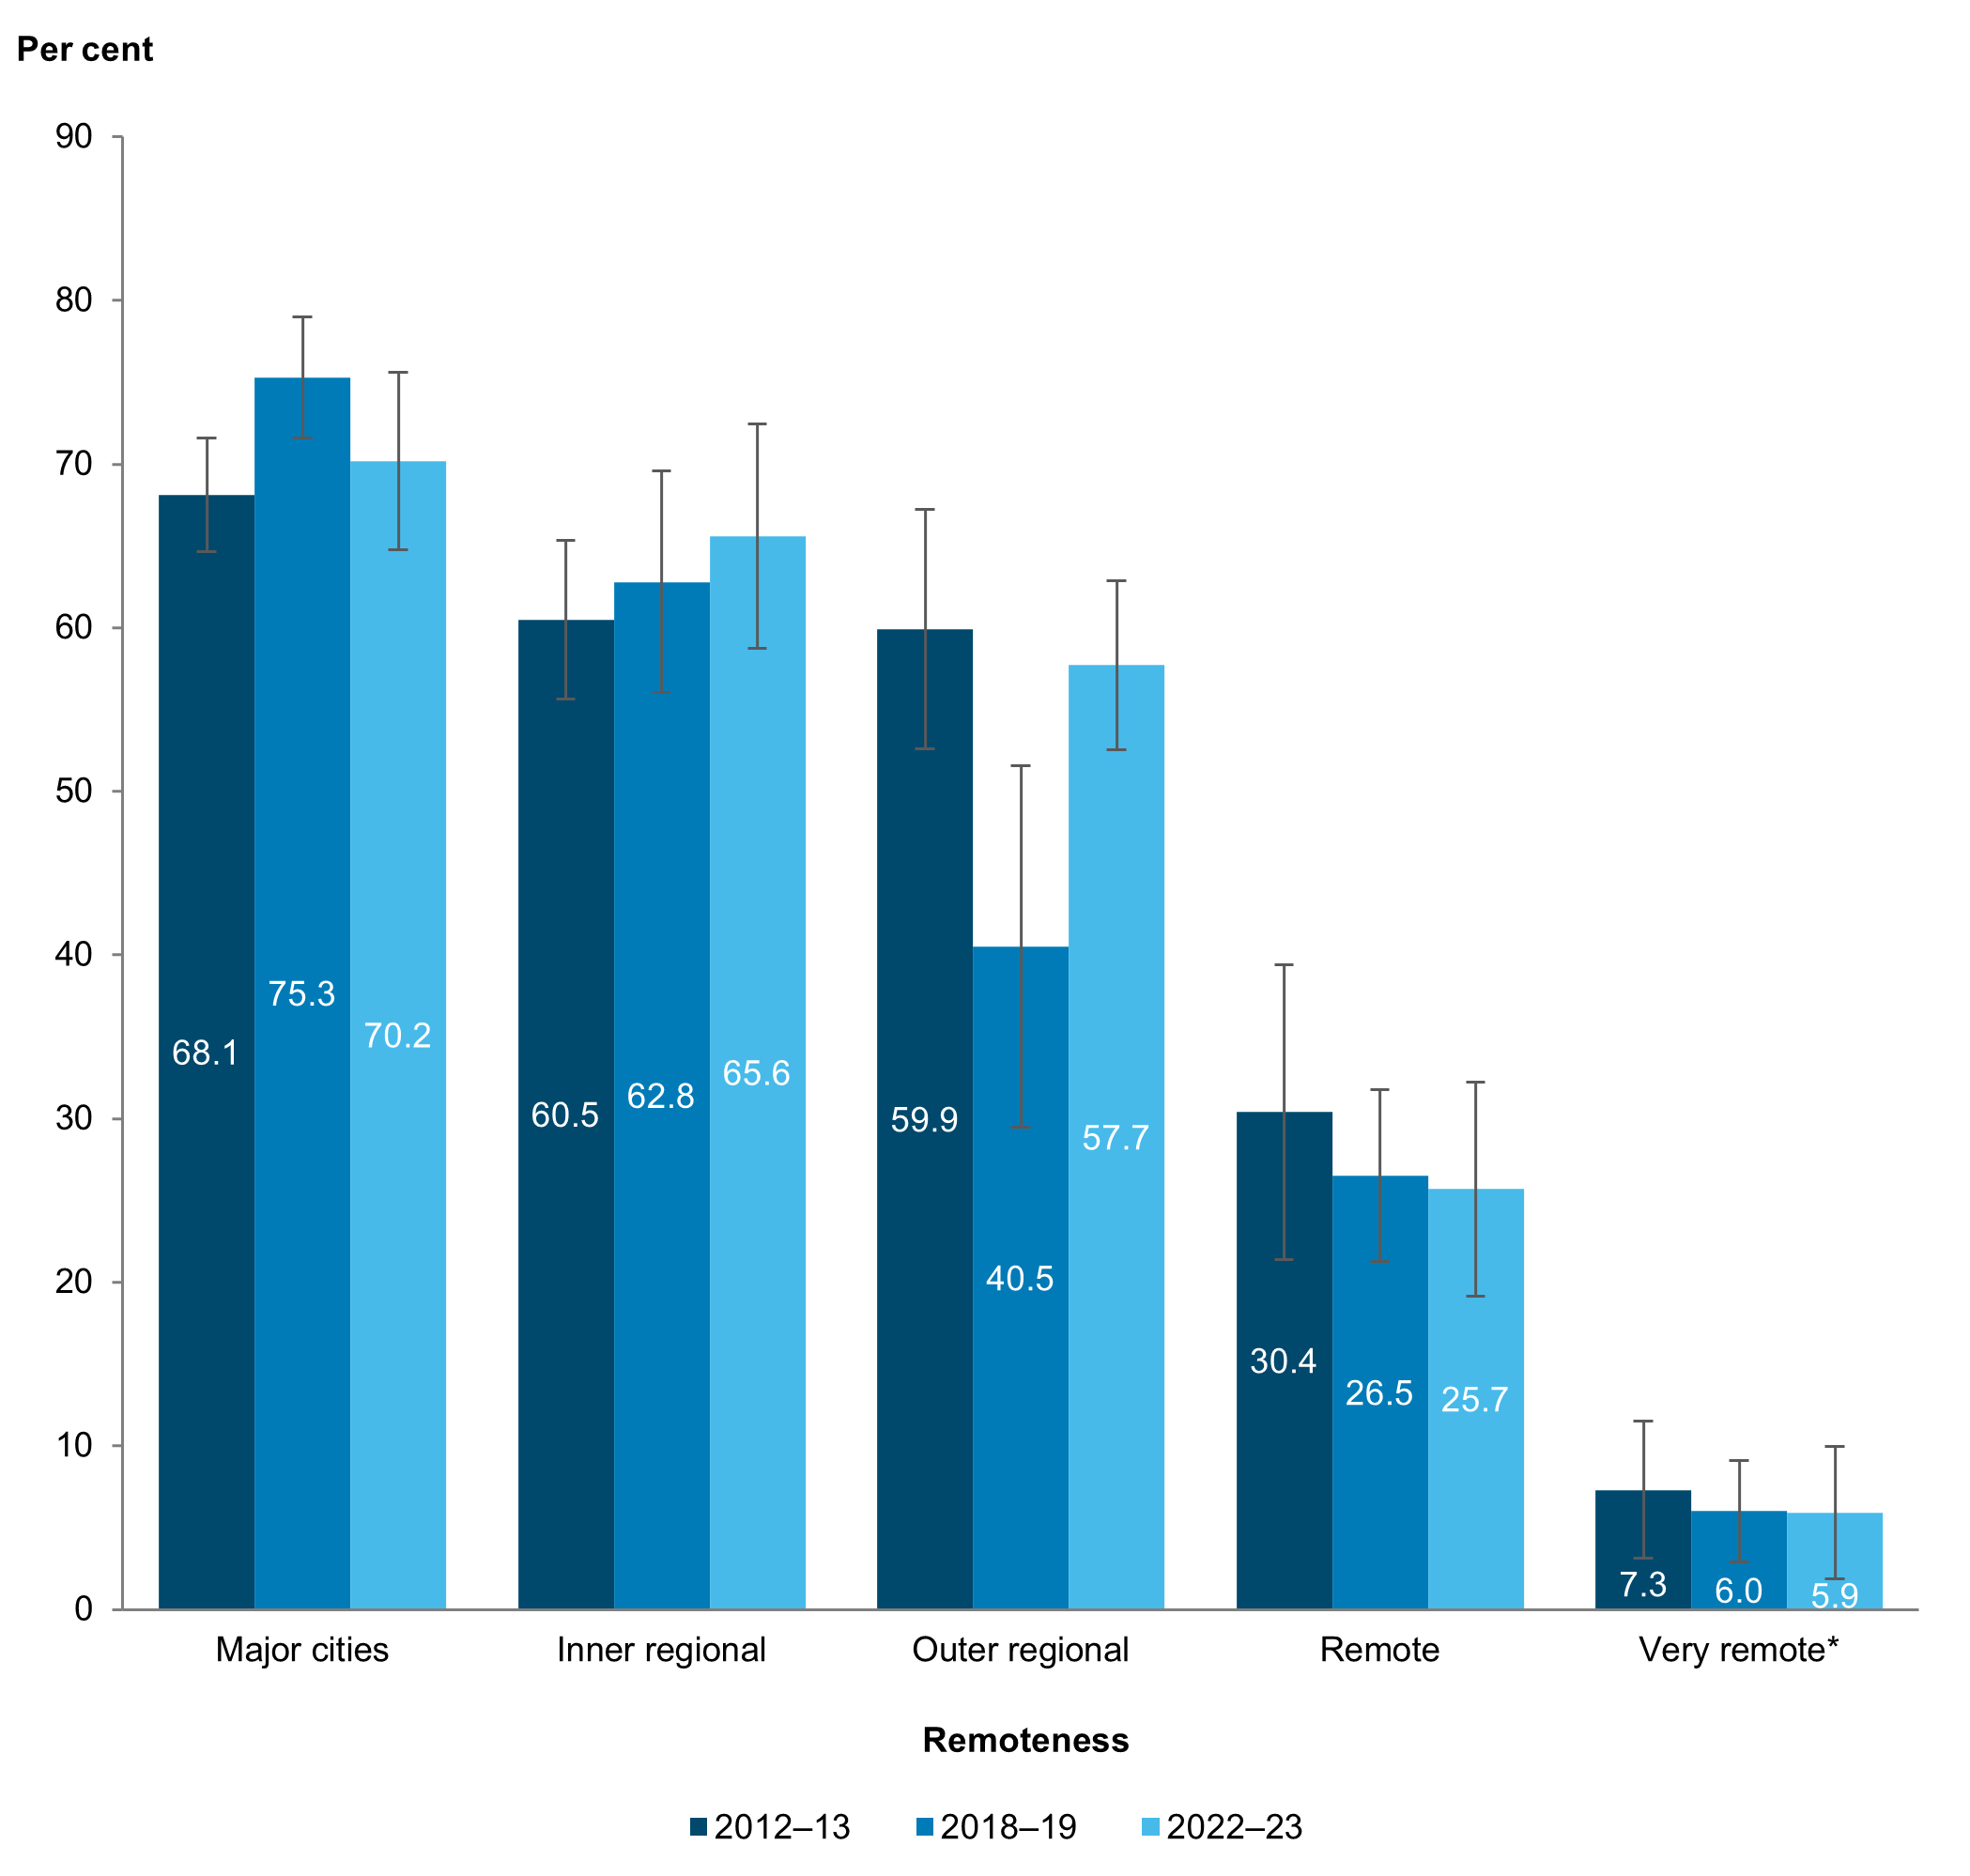
* Estimate has a relative standard error between 25% and 50% and should be used with caution.
Notes:
- Data are population weighted estimates.
- While non-overlapping confidence intervals (CIs) generally indicate statistical significance, overlapping CIs do not necessarily imply that a difference is not significant. See Technical notes for more information.
Source: AIHW analysis of 2012–13, 2018–19 and 2022–23 NATSIHS using TableBuilder (ABS 2013, 2019, 2025).