How many people had multiple services in their local areas?

As well as looking at the distribution of each type of health service (see Figures 1 and 2), it is also important to know how many Aboriginal and Torres Strait Islander people have access to an AMS/CC or mainstream GP in their local area.

In 2022–23, an estimated 595,000 (or 60% of) Aboriginal and Torres Strait Islander people had both an AMS/CC and a mainstream GP in their local area, 299,000 (30%) had a mainstream GP only, 88,500 (8.9%) had only an AMS/CC, and 12,100 (1.2%) had neither an AMS/CC nor a mainstream GP (Table 1). Those living in Outer regional and more remote areas were the most likely to have only an AMS/CC in their local area and the least likely to have only a mainstream GP (Figure 4).

Table 1: Aboriginal and Torres Strait Islander people, types of health services available in their local area, 2022–23

Available in local area

Number

%

AMS/CC only

88,457

8.9

AMS/CC and mainstream GP

594,629

59.8

Mainstream GP only

298,817

30.1

Neither

12,064

1.2

Total

993,967

100.0

Note: Data are population weighted estimates.

Source: AIHW analysis of 2022–23 NATSIHS using DataLab (ABS 2025).

The following data visualisation shows the distribution of the availability of AMS/CCs and mainstream GPs in Aboriginal and Torres Strait Islander people’s local area by remoteness, state/territory, SEIFA quintile and household income quintile.

Figure 4: Aboriginal and Torres Strait Islander people, whether an AMS/CC or mainstream GP was available in their local area, by type, selected categories and survey cycle

Bar chart shows that in 2022–23, 38% of Aboriginal and Torres Strait Islander people in Very remote areas had both an AMS/CC and a mainstream GP in their local area, compared with 56% in Major cities.

Bar chart shows that in 2022–23, 38% of Aboriginal and Torres Strait Islander people in Very remote areas had both an AMS/CC and a mainstream GP in their local area, compared with 56% in Major cities.

n.p. not published because of confidentiality or reliability concerns.

Notes:

  1. Data are population weighted estimates.
  2. While non-overlapping confidence intervals (CIs) generally indicate statistical significance, overlapping CIs do not necessarily imply that a difference is not significant. See Technical notes for more information.

Source: AIHW analysis of 2012–13, 2018–19 and 2022–23 NATSIHS using DataLab (ABS 2013, 2019, 2025).

Comparisons across survey cycles

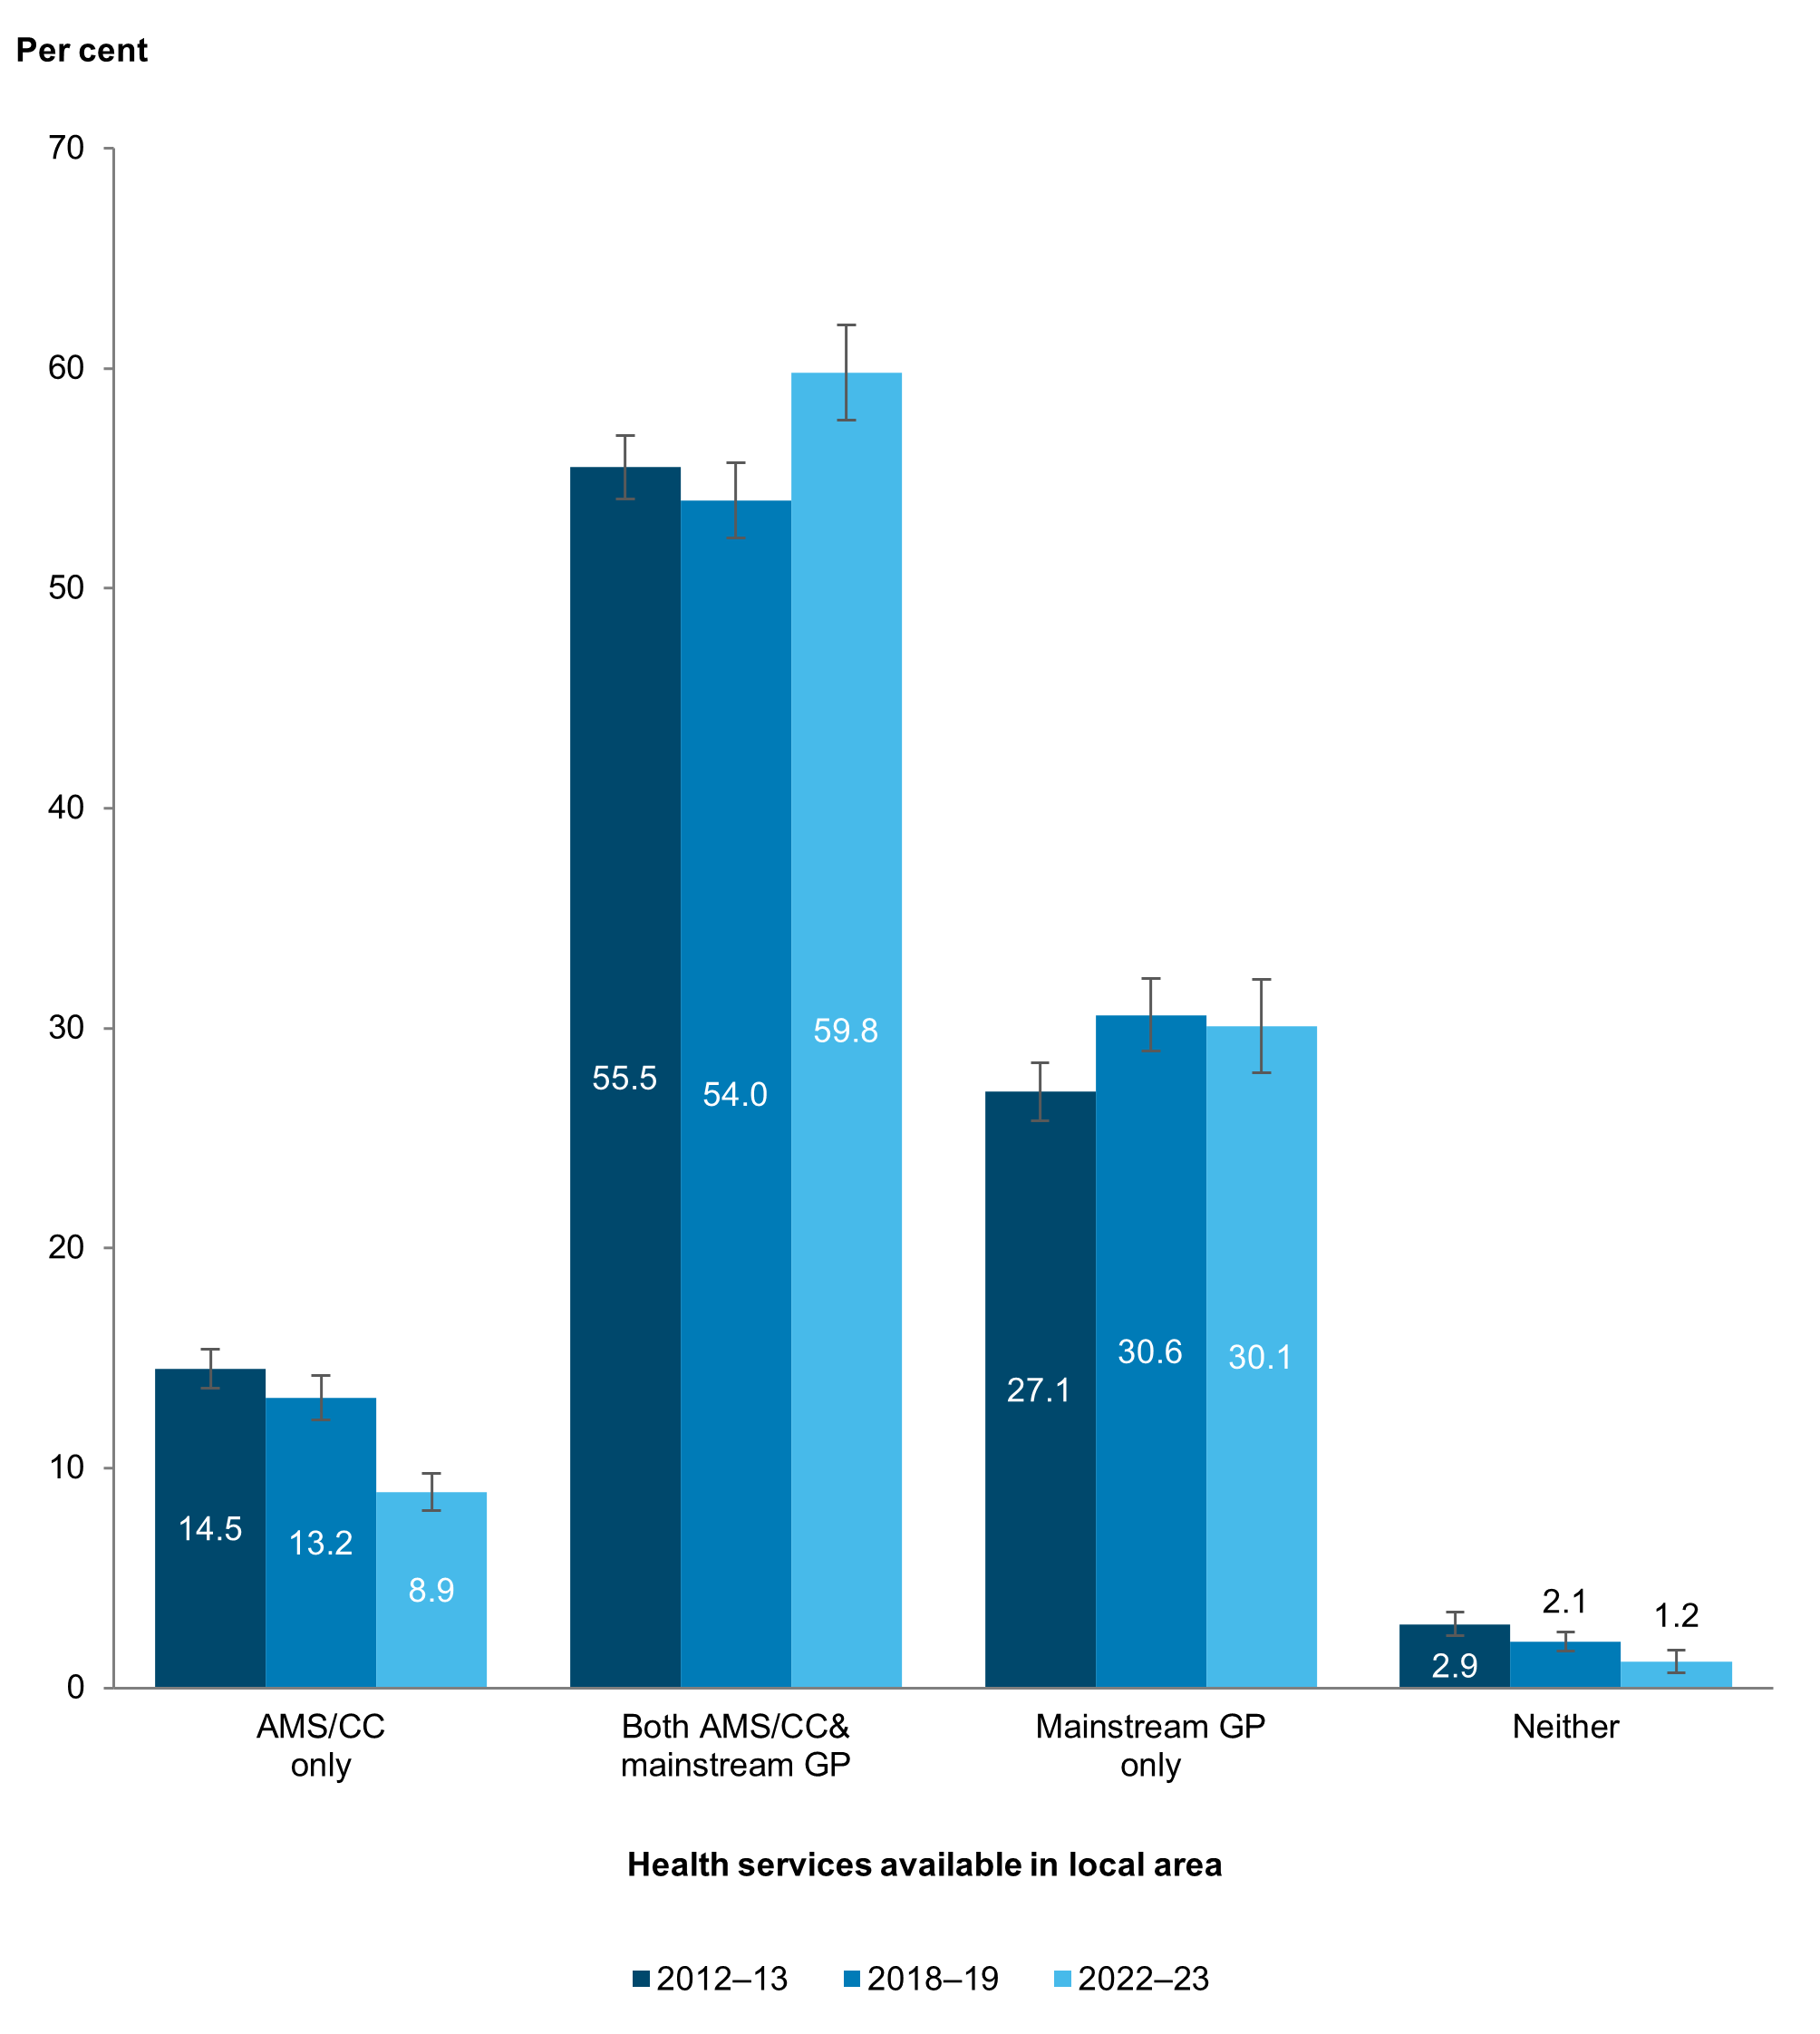
The proportion of Aboriginal and Torres Strait Islander people who had both an AMS/CC and a mainstream GP in their local area increased from 54% (or an estimated 440,000 of 814,000) in 2018–19 to 60% (595,000 of 994,000) in 2022–23. Those who had only an AMS/CC available decreased from 13% (or an estimated 108,000) to 8.9% (88,500) (Figure 5).

Figure 5: Aboriginal and Torres Strait Islander people, whether an AMS/CC or mainstream GP was available in their local area, by survey cycle

Bar chart shows that the proportion of Aboriginal and Torres Strait Islander people who only had a mainstream GP in their local area remained relatively steady between the 3 surveys – 27% in 20212–13, 31 in 2018–19 and 30% in 2022–23.

Notes:

  1. Data are population weighted estimates.
  2. While non-overlapping confidence intervals (CIs) generally indicate statistical significance, overlapping CIs do not necessarily imply that a difference is not significant. See Technical notes for more information.

Source: AIHW analysis of 2012–13 NATSIHS, 2018–19 NATSIHS and 2022–23 NATSIHS using DataLab (ABS 2013, 2019, 2025).