Unmet need

NATSIHS respondents were asked whether there was ever a time during the last 12 months when they (or their child) needed to go to a General Practitioner (GP) but did not. If there had been an occasion of unmet need, they were given a list of 13 potential reasons why they did not go and asked to tick as many as applied.

While this does not capture the reason why a visit to the GP was needed – for example, whether it was for an acute illness, chronic disease management, or preventive care – it is a direct measure of the person’s perceived unmet need.

In 2022–23, of the estimated 993,800 Aboriginal and Torres Strait Islander people:

  • 16% (159,000) had at least one instance in the last 12 months when they needed to see a GP but did not (had an unmet need), a significant increase from 13% (102,000) in 2018–19
  • 84% (835,000) had no unmet need for a GP, a significant decrease from 88% (713,000) in 2018–19.

Among Aboriginal and Torres Strait Islander people who always used the same source of health care, unmet need for a GP was similar for those whose usual source was a mainstream GP (15% or an estimated 84,200 of 459,000) and those whose usual source was an AMS/CC (14% or 34,300 of 249,000).

Figure 20 shows that in 2022–23:

  • Aboriginal and Torres Strait Islander people in Major cities had both the highest proportion (20%) and the highest number of people with unmet need (81,200) compared with all other remoteness areas
  • around 4.9% of (or an estimated 5,400 of 110,000) Aboriginal and Torres Strait Islander children aged 0–4 and 6% (or 13,000 of 216,000) of those aged 5–14 had an occasion of unmet need in the last 12 months, compared with 25% (or 50,000 of 200,000) of those aged 35–54. The 15–34 age group had the highest number with an unmet need (an estimated 65,800)
  • there were an estimated 76,800 Aboriginal and Torres Strait Islander people living in the most disadvantaged areas with unmet need
  • Aboriginal and Torres Strait Islander adults who had experienced unfair treatment in the last year had higher rates of unmet need (33% or an estimated 44,700 of 137,000) than those who had not experienced unfair treatment (19% or 77,800 of 416,000)
  • Aboriginal and Torres Strait Islander people with disability had considerably higher rates of unmet needs (25% or an estimated 92,300 of 368,000) than those who did not have disability (11% or 66,600 of 626,000).

The following data visualisation shows the distribution of whether Aboriginal and Torres Strait Islander people had an unmet need for a GP, by remoteness, state/territory, age group, SEIFA quintile, whether they experienced any unfair treatment in the last 12 months, and disability status.

Figure 20: Aboriginal and Torres Strait Islander people, unmet need for GP in the last 12 months, by selected categories and survey cycle

Bar chart shows that in 2022–23, 80% of Aboriginal and Torres Strait Islander people in Major cities had no unmet need for GP services in the last 12 months, compared with 93% in Very remote areas.

Bar chart shows that in 2022–23, 80% of Aboriginal and Torres Strait Islander people in Major cities had no unmet need for GP services in the last 12 months, compared with 93% in Very remote areas.

Notes:

  1. Data are population weighted estimates.
  2. While non-overlapping confidence intervals (CIs) generally indicate statistical significance, overlapping CIs do not necessarily imply that a difference is not significant. See Technical notes for more information.

Source: AIHW analysis of 2012–13, 2018–19 and 2022–23 NATSIHS using TableBuilder (ABS 2013a, 2019a, 2025a).

Reasons for unmet need

Respondents with unmet need for GP services could select as many of a set of 13 reasons as they wanted to explain why they were unable to obtain the health care they needed. As shown in Figure 21, the most common reasons for unmet need for GP services were long waiting times or the GP not being available at the time needed, being too busy, and deciding not to seek care. Without knowing the underlying reason for wanting to see a GP on the occasion, it is difficult to speculate why a person decided not to seek care, although it may be that the issue resolved itself (for example, an acute illness). Cost and transport/distance were the next most common reasons.

Figure 21: Aboriginal and Torres Strait Islander people, reasons had unmet need for a GP in the last 12 months, 2022–23

Bar chart shows that in 2022–23, for 47% of Aboriginal and Torres Strait Islander people the reason for their unmet need for GP services in the last 12 months was long waiting times.

Measure

Notes:

  1. Percentage distribution is calculated only on those who had at least one occasion of unmet need in the last 12 months. 
  2. Only reasons with an acceptable standard error were included. 
  3. The full wording of the graph label ‘Dislikes’ is ‘Dislikes (service/professional, afraid, embarrassed)’. Respondents were allowed to select multiple responses.
  4. Data are population weighted estimates.

Source: AIHW analysis of 2022–23 NATSIHS using TableBuilder (ABS 2025a).

Comparisons across survey cycles

There have been changes across survey cycles in why Aboriginal and Torres Strait Islander people had unmet need for a GP. Long waiting times or the GP not being available at the time needed significantly decreased from 22% (or an estimated 19,200 of 87,700) in 2012–13, to 16% (16,000 of 102,000) in 2018–19, before a large and significant increase to 47% (74,100 of 159,000) in 2022–23 (Figure 22). There was a similar pattern for cost, with a significant decrease from 13% (or 11,200) in 2012–13, to 7% (7,500 of 102,000) in 2018–19, before a large and significant increase to 19% (30,000 of 159,000) in 2022–23.

Figure 22: Aboriginal and Torres Strait Islander people, selected reasons had unmet need for a GP in the last 12 months, by survey cycle
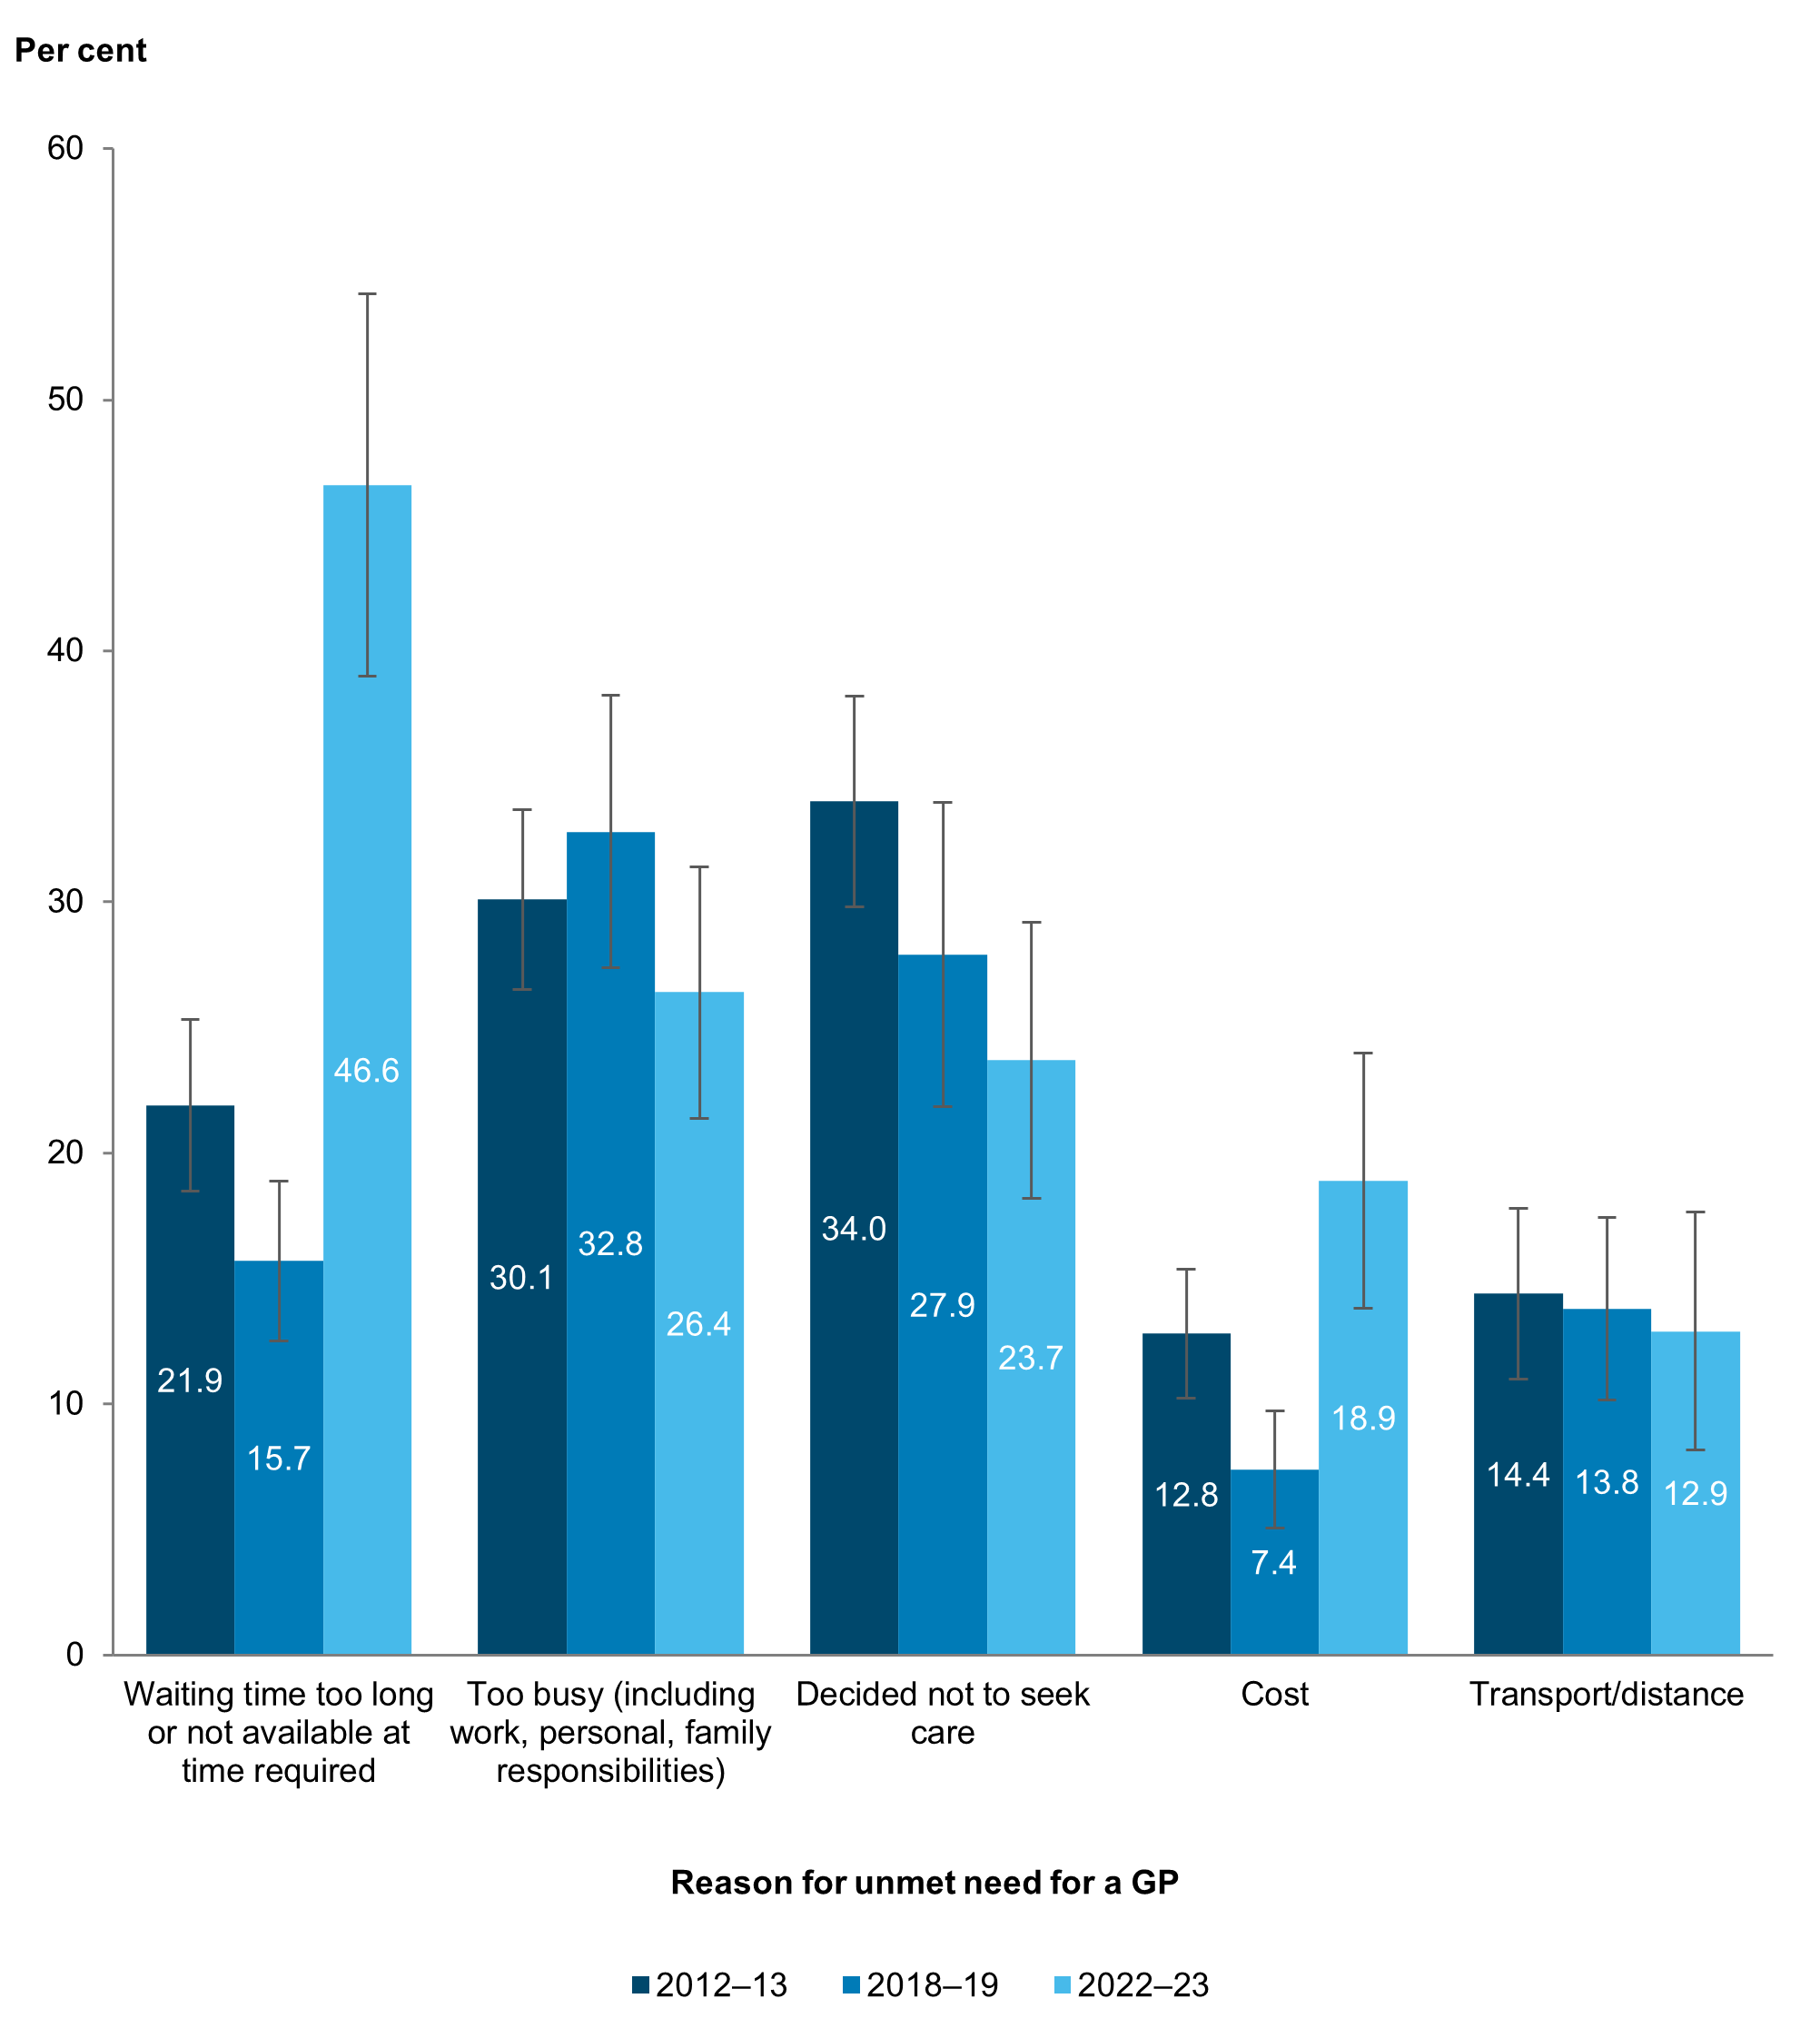
 Bar chart shows that ‘being too busy’ and ‘decided not to seek care’ as reasons for unmet need for GP services had overlapping 95% confidence intervals across the 3 surveys.

Notes:

  1. Data are population weighted estimates.
  2. While non-overlapping confidence intervals (CIs) generally indicate statistical significance, overlapping CIs do not necessarily imply that a difference is not significant. See Technical notes for more information.

Source: AIHW analysis of 2012–13, 2018–19) and 2022–23 NATSIHS using DataLab (ABS 2013b, 2019b, 2025b).