An overview of extreme weather-related injuries
The terms ‘hospitalisation’ and ‘case’ in this report refer to incidents where a person was admitted to hospital with injury as the main reason. Injuries were selected for this analysis where it was reasonable to conclude an association between adverse weather conditions and the type of injury. The Technical notes page of this report defines these terms, selected diagnosis and external cause of injury codes in more detail.
Defining extreme weather events
The Bureau of Meteorology defines extreme or severe weather as “potentially hazardous or dangerous weather that is not solely related to severe thunderstorms, tropical cyclones or bushfires” (BoM 2022a). In this report we have utilised administrative health and mortality datasets as well as BoM weather data, defining extreme weather or related natural hazards as extreme heat, extreme cold, rain or storms and bushfires.
In the ten years from 2012–13 to 2021–22, there were 9,119 hospitalisation records with evidence of extreme weather-related injury in Australia. From 2011–12 to 2020–21, there were 677 extreme weather-related injury deaths – an average of 68 per year (Table 1). Injury hospitalisations and deaths present underestimates of the burden of disease and public health impact of extreme weather (Cascio 2018).
| Extreme weather event | Hospitalisations 2012–13 to 2021-22 | Deaths 2011–12 to 2020-21 |
|---|---|---|
Heat | 7,104 | 293 |
Bushfire | 894 | 65 |
Cold | 773 | 242 |
Rain and storms | 348 | 77 |
Total | 9,119 | 677 |
Source: AIHW National Hospital Morbidity Database (NHMD) and AIHW National Morbidity Database (NMD).
Climate drivers
Hospitalisations and deaths from extreme weather-related injuries vary between years dependant on prevailing local conditions at the time. Local conditions are influenced by broader climate drivers such as the El Niño-Southern Oscillation (ENSO).
Total extreme weather-related hospitalisations are increasing over time and exceeded 1,000 cases three times in the ten years since 2012–13 (Figure 1, Figure 4).
Across all years, heat was by far the largest contributor to extreme weather-related injuries. Extreme heat can cause injuries both directly and by indirect effects on bushfires. The proportion of injury hospitalisations caused directly by extreme heat varied from 70% to 84% (Figure 1). Extreme heat also caused the most deaths, followed by cold weather.
Deaths directly attributable to bushfires and rain and storms are less common, accounting for only 1 in 5 extreme weather-related deaths (when combined). However, this may be dependent on the size and scale of the events – there was a 15-fold annual increase in bushfire-related deaths in 2019–20 as compared to 2018-19 (Figure 2). Deaths data relating to widespread flooding in 2022 was not available at time of reporting.
Figure 1: Extreme weather-related injury hospitalisations, 2012–13 to 2021-22
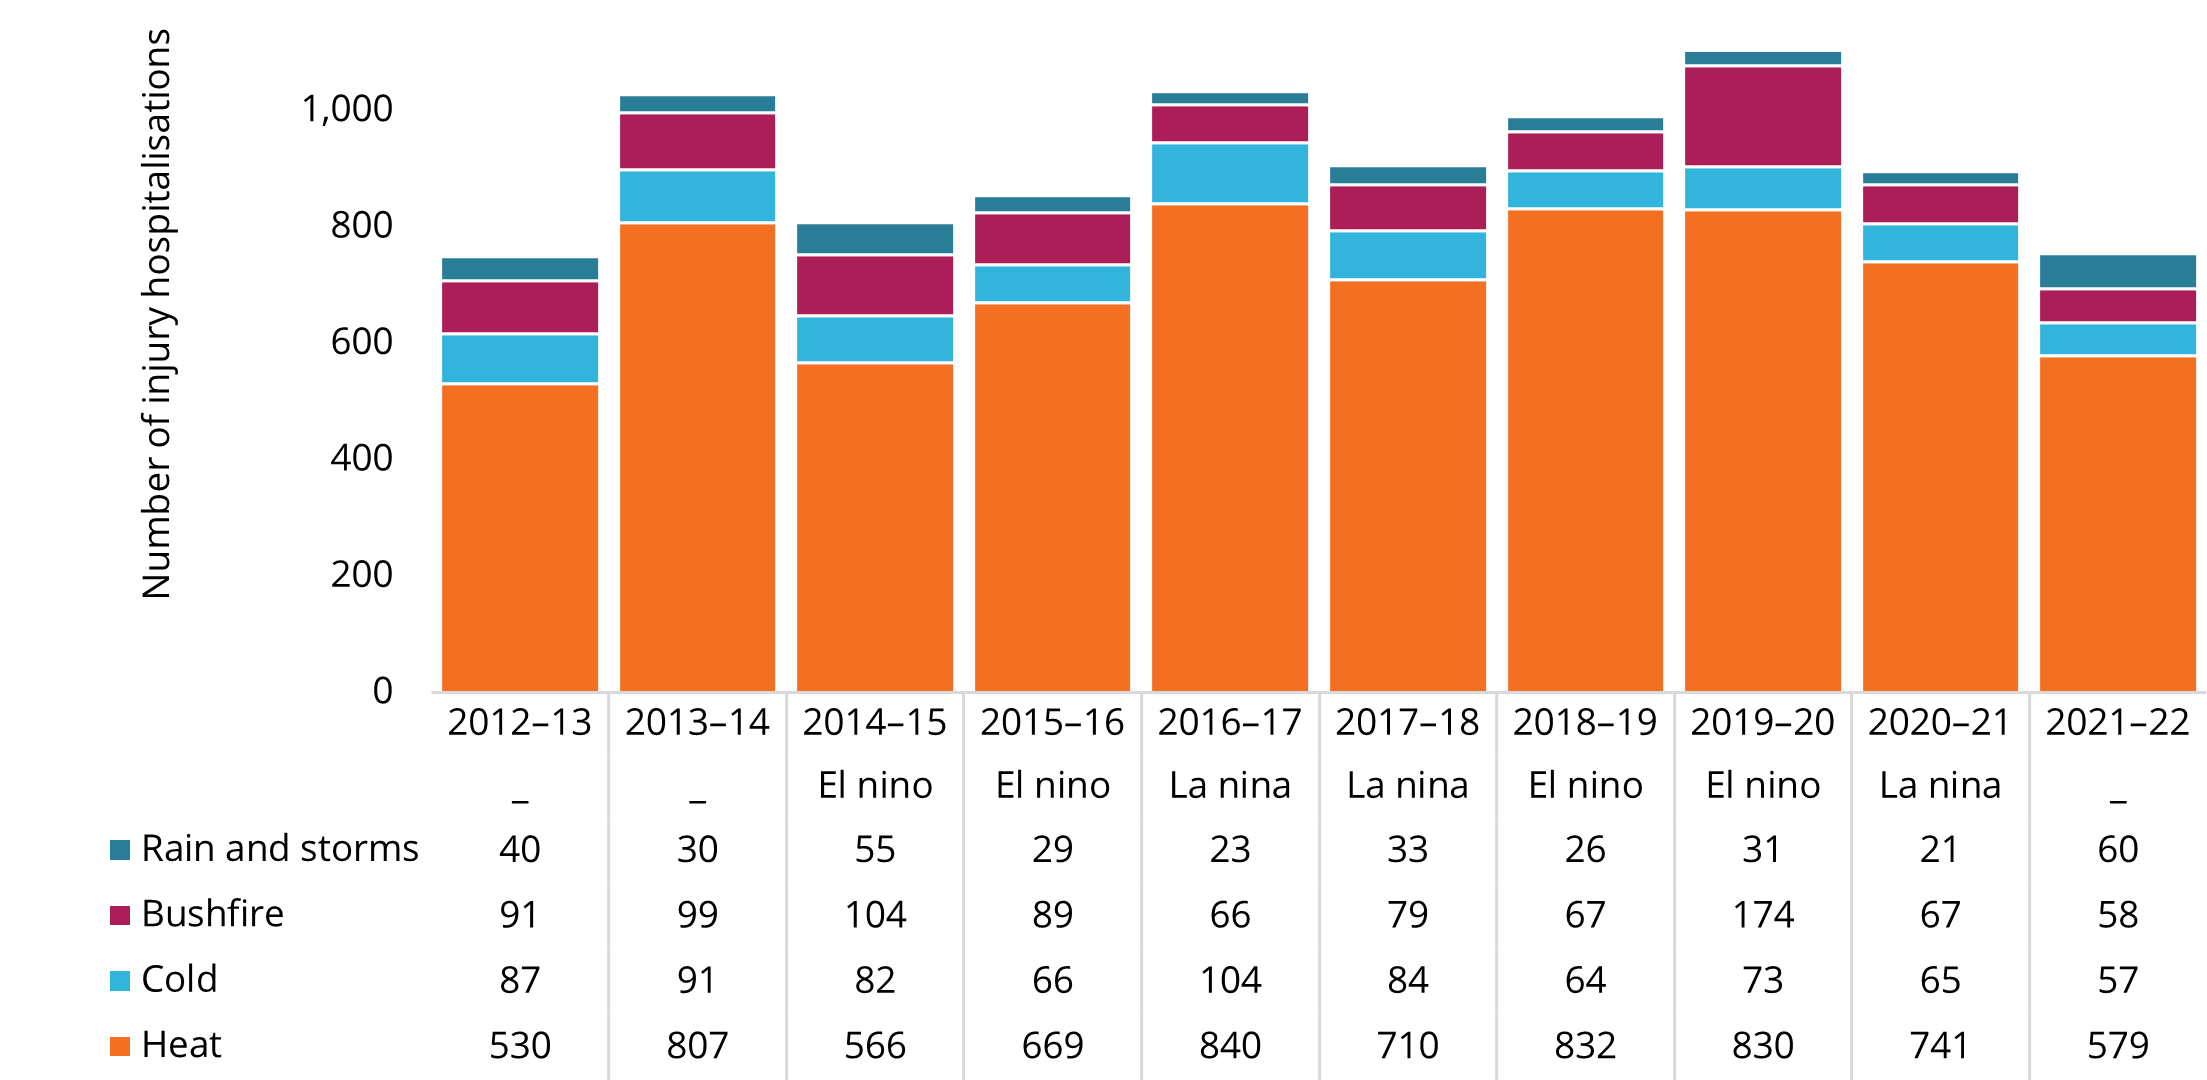
Source: National Hospital Morbidity Database (NHMD)
For more information see supplementary data table 1.
Figure 2: Extreme weather-related injury deaths, 2011–12 to 2020-21
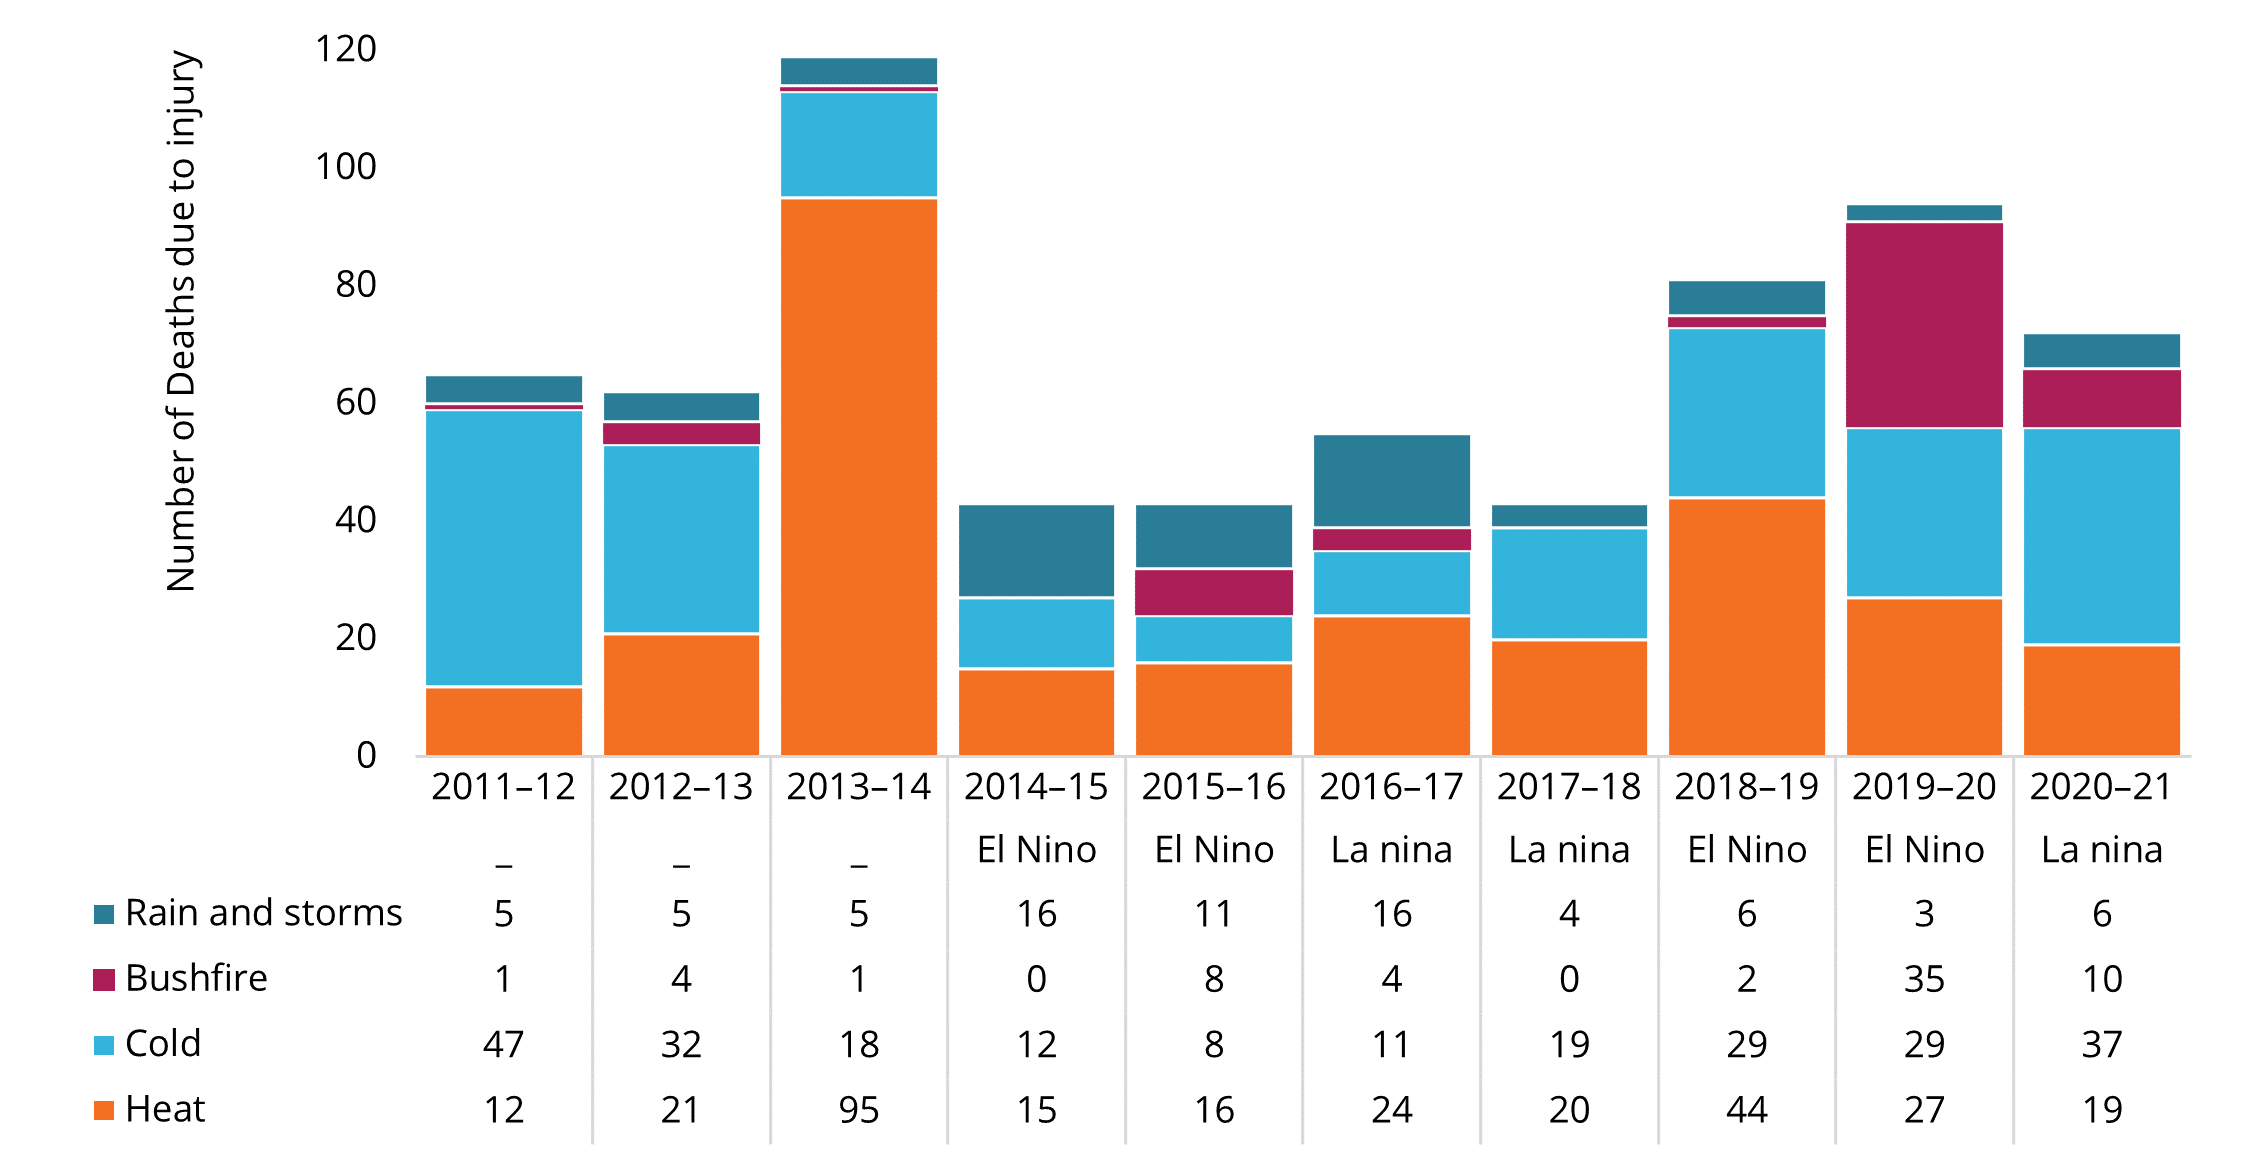
Source: National Hospital Mortality database (NMD)
For more information see supplementary data table 6.