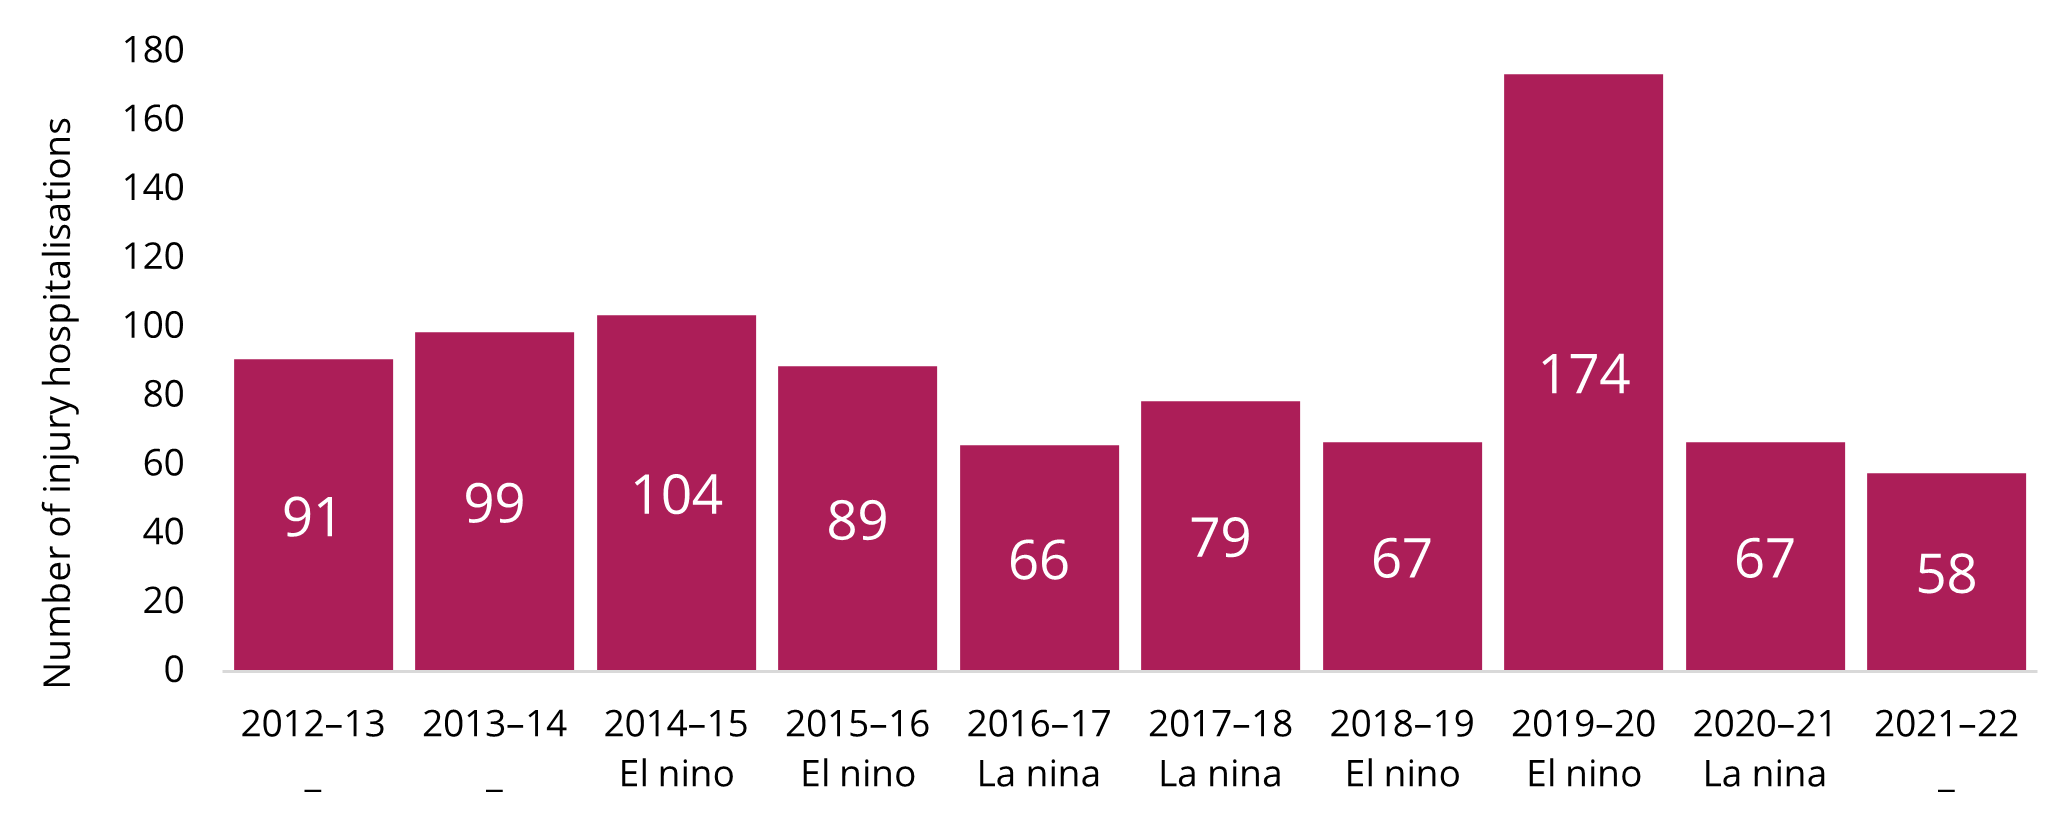
2019–20 Bushfires
In 2019–20, the number of bushfire-related injuries increased by 61% from the previous reporting year, partially as a result of the NSW and Victorian summer bushfires (Figure 11).
Figure 11: Hospital admissions for bushfire-related injuries spiked in 2019–20 as a result of widespread fires
Source: National Hospital Morbidity Database (NHMD)
Bushfires are defined in this report as records where there was a principal diagnosis of T20 – T30 – Burns, T58 ¬– Toxic effect of carbon monoxide, T59.8 – Other specified gases, fumes, and vapours, AND there was an external cause of injury relating to bushfire or heat including X01 – Exposure to uncontrolled fire, not in building or structure, X30 – Exposure to excessive natural heat. This may differ from other AIHW reporting.
For more information see supplementary data table 1.
It is worth noting that injuries caused by exposure to excessive natural heat were also among their highest levels during this period– 830 in 2019–20 compared to a yearly average of 710 (Figure 1). This likely includes injuries occurring because of the extremely hot weather which contributed to the bushfires, if not directly due to the fires. The number of bushfire-related deaths was 15 times higher in 2019–20 as compared to 2018-19 (Figure 2).