Extreme heat
Heat is the most frequent cause of extreme weather-related injury hospitalisations and deaths in Australia (Table 1).
Extreme heat often occurs in heatwaves, which the Australia’s Bureau of Meteorology describes as three or more days of high maximum and minimum temperatures that are unusual for a given location (BoM 2022b).
How extreme heat affects injury
Exposure to prolonged or severe natural heat can result in physical conditions ranging from mild heat stroke symptoms to death (DEA 2016).
High temperatures are also linked to irritability, fatigue, and decreased performance, which can increase the risk of injury by impacting behaviour such as operating vehicles and power tools. There is evidence to suggests that higher daily temperatures are associated with an increased propensity for assault (Corcoran & Zahnow 2021). The risk of drowning deaths has also been shown to increase during heatwaves (Peden et al. 2023).
Heatwaves are Australia’s most dangerous natural hazard in terms of loss of life (Coates et al. 2022; DAWE 2015). Heatwave-related deaths peak during severe El Niño years (Table 2). Since 2000, heatwave deaths in Australia have been concentrated in events that largely affected Victoria and South Australia (Coates et al. 2022).
Hospitalisations due to extreme heat by age and sex
For heat related injuries between 2019–20 and 2021–22, those aged 65 and over were the most commonly hospitalised followed by the 25–44 age group (Figure 6). Across age groups, males had higher numbers of heat related injury hospitalisations than females, but this difference was most notable among those aged 25-44 and 45-64 years, where over twice as many males were hospitalised due to extreme heat as were females.
Figure 8: Number of injury hospitalisations due to extreme heat by age and sex, Australia 2019–20 to 2021–22
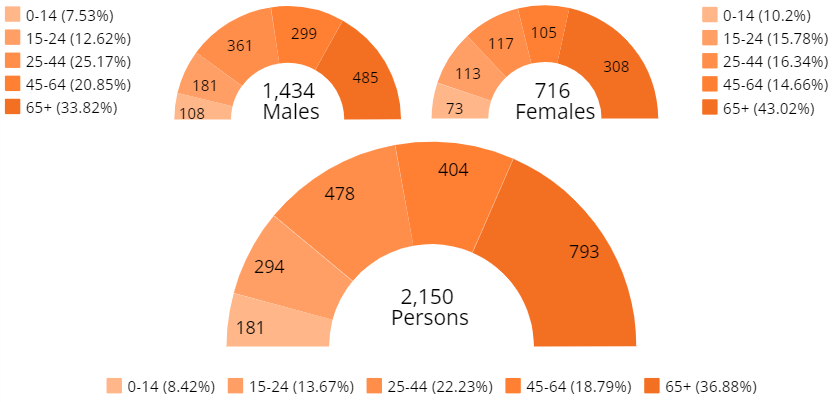
Source: National Hospital Morbidity database (NHMD)
For more information see Supplementary data table 3.
Figure 9: The number of days with extreme heat are increasing across Australia over time
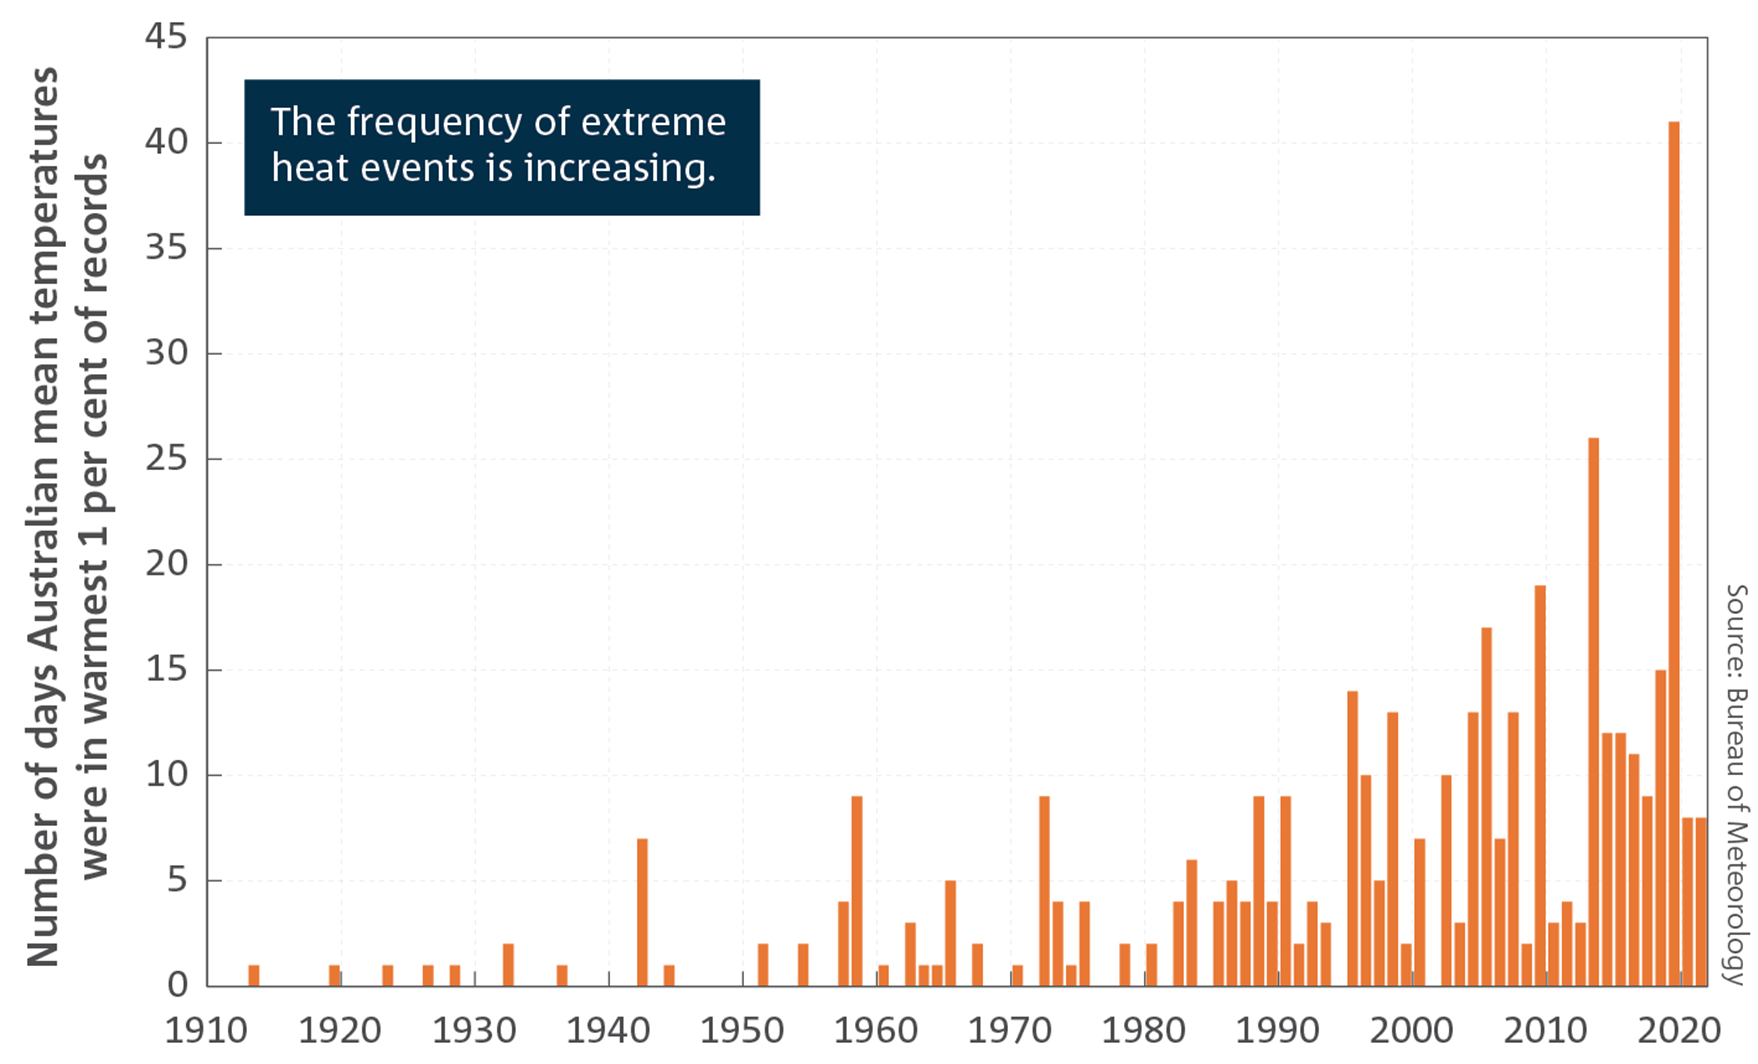
Source: BOM, State of the Climate 2022