The ENSO climate cycle is reflected in injuries
Australia’s weather is influenced by many factors in both the long- and short-term. When considering annual variation, one of the largest drivers is the El Niño–Southern Oscillation (ENSO) cycle (BoM 2021, Figure 3). El Niño is driven by warmer water surface temperatures in the central eastern Pacific Ocean, while La Niña occurs when the water surface temperatures are higher in the western Pacific.
In Australia, El Niño drives a period of:
- Reduced rainfall
- Warmer temperatures
- Increased bushfire danger
While La Niña is associated with:
- Above average rainfall
- Cooler daytime temperatures
- Increased chance of tropical cyclones and flood events
Figure 3: Annual global surface temperature anomalies of the Earth (land and ocean), 1950–2021.
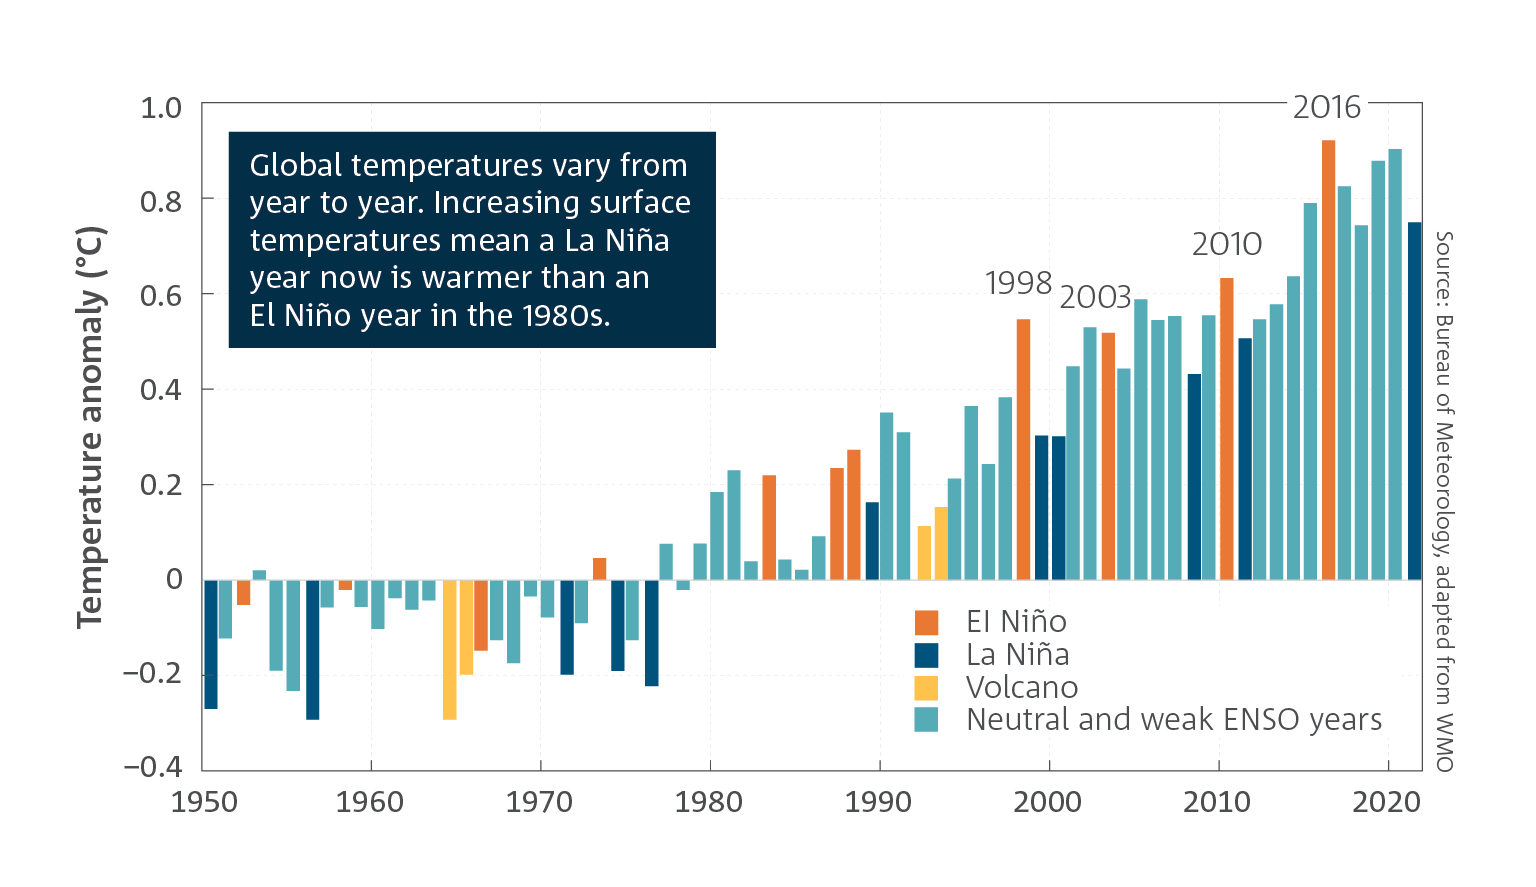
Source: BOM, State of the Climate 2022
Weather events leading to injury can occur under either phase of the ENSO cycle, however some are more likely under certain prevailing conditions.
On average, bushfire injuries occur 1.6 times as often in El Niño years (Table 2).
For more detail, see data table B1
| Heat | Cold | Bushfire | Rain and storms | Total |
|---|---|---|---|---|---|
El Niño | 724 | 71 | 108 | 35 | 938 |
La Niña | 717 | 77 | 67 | 34 | 895 |
Ratio El Niño:La Niña | 1.0 | 0.9 | 1.6 | 1.0 | 1.0 |
Source: AIHW National Hospital Morbidity Database (NHMD).
Total extreme weather-related injury hospitalisations are increasing over time, exceeding 1,000 cases three times in the ten years since 2012–13 (Figure 4).
Figure 4: Extreme weather- related injury hospitalisations are increasing and rose above 1,000 cases in 3 out of ten years over the past decade
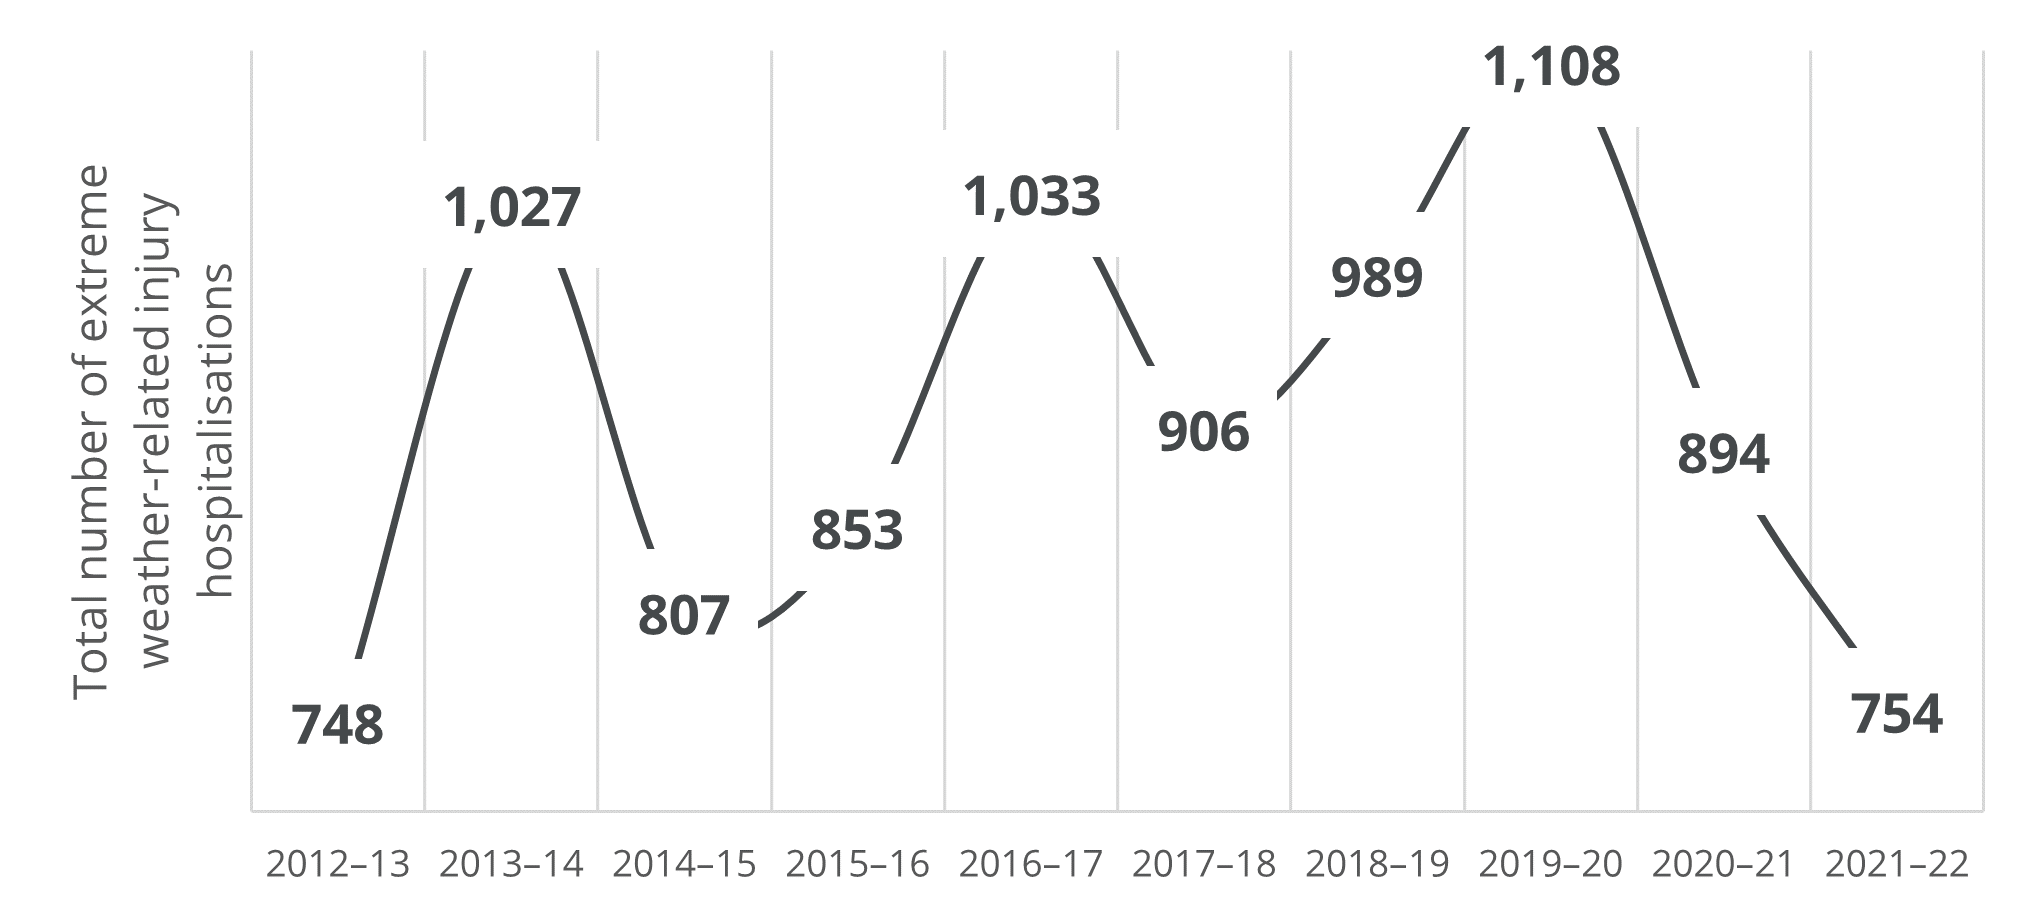
For more information see Supplementary Data Table 1