Emergency department presentations
As the external cause of injury cannot be determined for ED presentations (see Technical notes for details), we can only provide information on the impact of age and sex on ED presentations for injury as a whole, and are unable to distinguish between specific causes of injury.
More males presented to ED with injuries than females (see Supplementary data Table E1), however the age patterns for ED presentations differed to those for hospitalisations or deaths (Figure 17).
Younger people had higher ED injury presentation rates than adults, with 0–4-year-olds at 11,344.7 per 100,000 persons, dropping to 4,874.3 per 100,000 persons for 45–64 year-olds, then rising to 6,413.5 for people aged 65 and over. In 2024–25, there were 781,344 presentations for people under 24 (42.7% of the total 1.8 million ED presentations), compared to 430,259 presentations for ages 25-44 (23.5%).
Figure 17: ED presentations for injury by age group, 2024–25
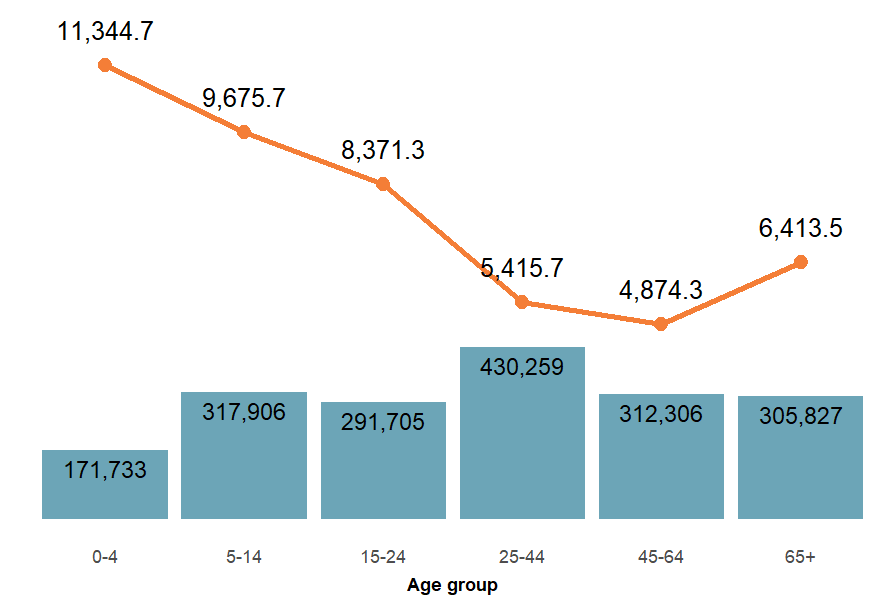
Note: Columns are case counts, while the line graph represents crude rates per 100,000 population.
Sources: AIHW National Non-admitted Patient Emergency Department Care Database and ABS National, state and territory population.
For more detail, see Supplementary data Table E3.