Hospitalisations
In 2024–25, 54.7% of injury hospitalisations were among males (319,928 cases, 2,351.3 per 100,000 population) and 45.2% among females (264,249 cases, 1,915.2 per 100,000).
Males were more likely to be injured and hospitalised across all causes except for:
- falls (1,020.7 females and 829.3 males per 100,000)
- intentional self-harm (104.7 females and 59.3 males per 100,000) (Figure 18)
Males were hospitalised nearly 2.6 times more frequently than females due to injuries from contact with objects. Likewise, for transport-related injuries, males were hospitalised at more than twice the rate of females.
Figure 18: Injury hospitalisations by injury cause and sex, 2024–25
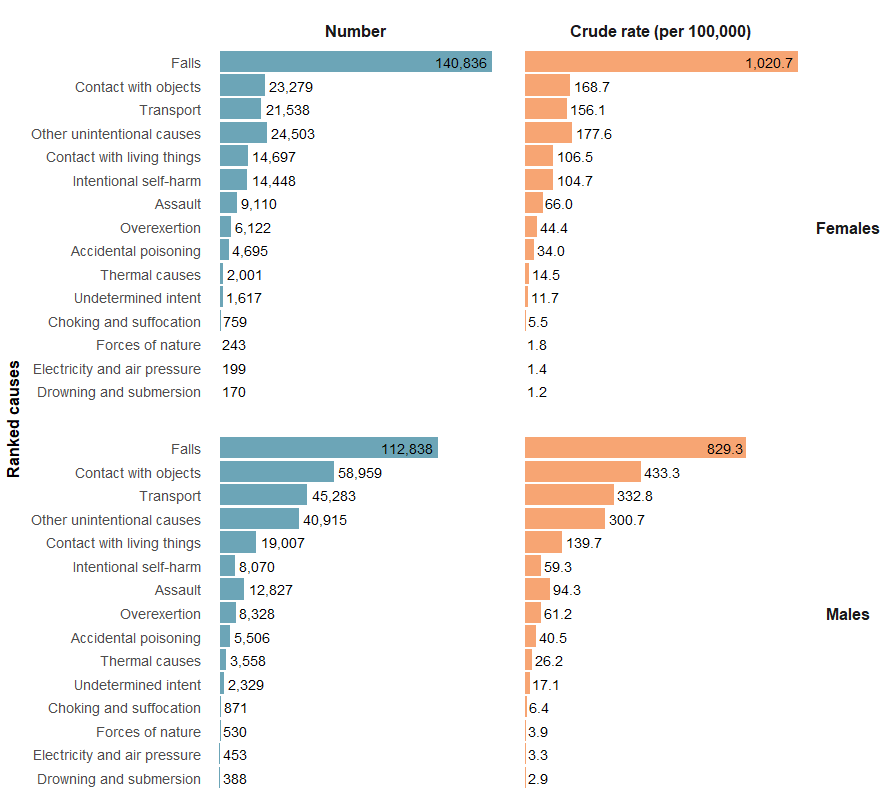
Note: Causes are ranked by descending number of hospitalisations for all persons (Figure 4)
Sources: AIHW National Hospital Morbidity Database and ABS National, state and territory population.
Hospitalisations and deaths due to injuries generally increased with age for both sexes, reaching their peak rates after age 75 (Figure 16). Hospitalisation rates were slightly higher for adolescents and young adults (ages 10-20) for both sexes compared with younger children and working-age adults.
Males were more likely to be hospitalised with injuries than females across all age groups younger than 65, after which females were slightly more likely to be hospitalised. Across age groups, the highest numbers of cases overall were in males aged 15–19 (23,696 cases) and females aged 80–84 (21,749 cases).
For more detail, see Supplementary data Tables H1 and H2.
Trends by age
Over the past decade, rates of injury hospitalisation have remained steady or decreased slowly for most younger age groups but increased for adults aged 45 and over (Figure 19).
Figure 19: Trends in injury hospitalisations (2015–16 to 2024–25) and deaths (2014–15 to 2023–24) by age
The interactive chart shows injury hospitalisation and death trend data, by age group over the past decade.