First Nations people

Among Aboriginal and Torres Strait Islander (First Nations) people, there were (Figure 21):

  • 155,582 ED presentations with a primary diagnosis of injury in 2024–25

    • a rate of 14,823.4 presentations per 100,000 population
    • 71,421 presentations for females (13,661.9 per 100,000)
    • 84,120 presentations for males (15,968.1 per 100,000)
  • 37,730 injury hospitalisations in 2024–25

    • a rate of 3,594.8 per 100,000 population
    • 17,289 for females (3,307.2 per 100,000)
    • 20,430 for males (3,878.1 per 100,000)
  • 701 injury deaths in 2023–24

    • a rate of 68 per 100,000 population
    • 197 for females (38.4 per 100,000)
    • 504 for males (97.5 per 100,000)

    Deaths data only includes NSW, Qld, WA, SA and NT. See Technical notes for details.

Figure 21: Injury ED presentations, hospitalisations (2024–25) and deaths (2023–24) among First Nations people by sex and age group
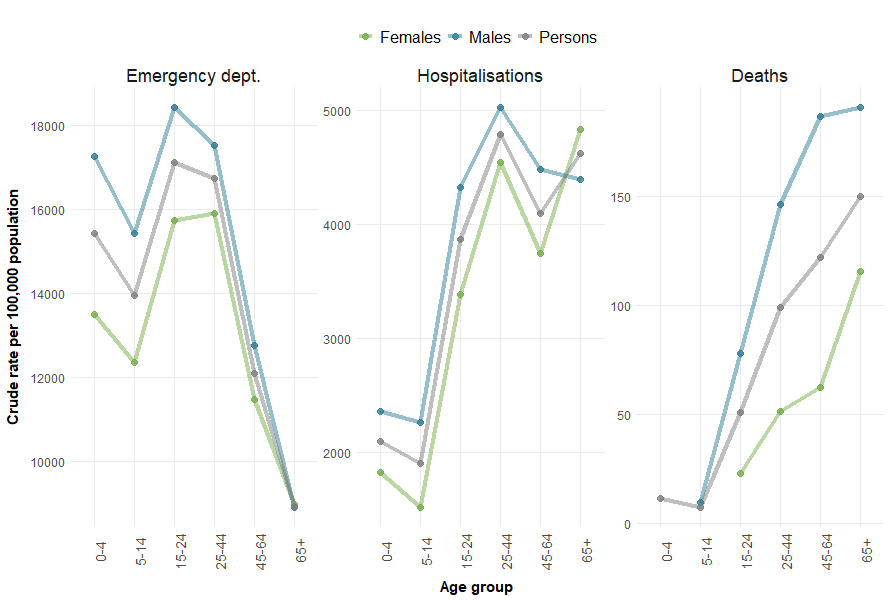
Figure 21 is a line chart showing ED presentations for First Nations people are most common in 15-24 year olds, while hospitalisations are highest among people aged 65 and over

Notes:

  1. Crude rates per 100,000 population.
  2. Person totals include hospitalisations and ED presentations where the sex of the patient was other, inadequately described or not stated.
  3. Deaths data only includes data for New South Wales, Queensland, Western Australia, South Australia, and the Northern Territory, as these jurisdictions are considered to have adequate levels of Indigenous identification in mortality data.

Sources: AIHW National Hospital Morbidity Database, AIHW National Mortality Database, AIHW National Non-admitted Patient Emergency Department Care Database, and ABS Estimates and Projections, Aboriginal and Torres Strait Islander Australians.

ED presentations

In 2024–25 there were 155,582 injury ED presentations among First Nations people – a rate of 14,823.4 per 100,000 population, or 18.5% of their total ED presentations.

ED injury presentations varied by age: those aged 15–24 were most likely to present and people aged 65 and over were the least (Figure 21). As for all Australians, younger First Nations males presented to ED more frequently than females, but this difference was not observed among older adults aged 65 and over.

Most injury ED presentations were triaged as Semi-urgent (48.6%), 29.1% as Urgent, and 1.5% as Resuscitation (see Supplementary data Table E10). See Severity for general information on triage categories.

Hospitalisations

Falls, assault and contact with objects were the leading causes of injury-related hospitalisations among First Nations people, at rates of 890.5, 699 and 537.7 hospitalisations per 100,000 respectively. Falls were the top cause for both First Nations males and females (890.1 and 890.8 cases per 100,000, respectively) with the risk increasing with age (Figure 22).

Figure 22: Ranked causes of injury hospitalisation by age and sex among First Nations people, 2024–25
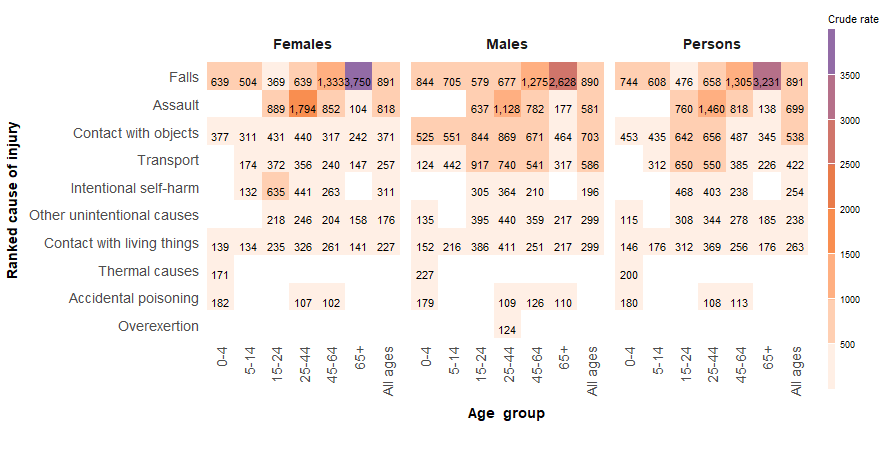
Figure 22 shows a heatmap of injury hospitalisations by cause, age and sex for First Nations people. Falls were the main cause of injury across most age groupsNotes:

  1. Density map of crude rates of hospitalised cases of injury causes by age and sex.
  2. Rates are crude rates per 100,000 population, rounded to a whole number.
  3. Rates under 100 are not displayed.
  4. Some external causes of injury are not displayed.

Sources: AIHW National Hospital Morbidity Database and ABS Estimates and Projections, Aboriginal and Torres Strait Islander Australians.

Comparing First Nations males and females:

  • In 2024–25 First Nations males were

    • 1.2 times as likely to be hospitalised due to an injury, overall
    • 2.3 times as likely to be hospitalised due to transport-related injuries

    (compared to First Nations females)

  • In 2024–25 First Nations females were

    • 1.6 times as likely to be hospitalised due to intentional self-harm
    • 1.4 times as likely to be hospitalised due to assault

    (compared to First Nations males)

The risk of injury varied by age among First Nations people (Figure 22). In general, those aged 25-44 had the highest rate of injury hospitalisations, with 4,788.2 cases per 100,000 population.

Deaths

The leading cause of death for First Nations people was suicide (23.3 per 100,000 population, Table 6).

Table 6: Top 6 ranked causes of death among First Nations people, by sex, 2023–24

Number of deathsMortality rate

External cause of injury

 Males

 Females

 Persons

Males

Females

Persons

All external causes

504

197

701

97.5

38.4

68.0

Suicide

188

52

240

36.4

10.1

23.3

Accidental poisoning

99

49

148

19.2

9.5

14.4

Transport

90

32

122

17.4

6.2

11.8

Falls

38

35

73

7.4

6.8

7.1

Choking and suffocation

31

11

42

6.0

2.1

4.1

Homicide

24

12

36

4.6

2.3

3.5

Notes:

  1. Deaths data only includes data for New South Wales, Queensland, Western Australia, South Australia, and the Northern Territory, as these jurisdictions are considered to have adequate levels of Indigenous identification in mortality data.
  2. The sum of the counts by cause may be greater than the total number of injury deaths because some deaths have multiple causes.
  3. Mortality rates are crude per 100,000 population. 

Sources: AIHW National Mortality Database and ABS Estimates and Projections, Aboriginal and Torres Strait Islander Australians.

Trends by cause

The age-standardised rate (ASR) of injury hospitalisations among First Nations people has steadily increased from 3,501.2 per 100,000 (representing 30,550 cases) in 2019–20 to 3,929.4 per 100,000 in 2024–25 (37,730 cases) (Figure 23). The most recent rate is an 8.4% increase compared with the average rate of 3,625.7 reported over the 5-year period from 2019–20 to 2023–24.

Figure 23: Trends in injury hospitalisations (2017–18 to 2024–25) and deaths (2017–28 to 2023–24) among First Nations people by cause

Figure 23 shows a timeline for injury hospitalisations and death by causes for First Nations people from 2017–18 to 2024–25

Figure 23 shows a timeline for injury hospitalisations and death by causes for First Nations people from 2017–18 to 2024–25

Notes:

  1. Deaths data only includes data for New South Wales, Queensland, Western Australia, South Australia, and the Northern Territory, as these jurisdictions are considered to have adequate levels of Indigenous identification in mortality data.
  2. Age-standardised rates per 100,000 population.

Sources: AIHW National Hospital Morbidity Database, AIHW National Mortality Database, and ABS Estimates and Projections, Aboriginal and Torres Strait Islander Australians.

The largest change in injury hospitalisations by cause (based on age-standardised rates) compared to the previous 5-year average was observed for Electricity and air pressure (a 51.7% increase, from 2.9 to 4.4 per 100,000 population in 2024–25). Other notable changes include: 

  • Contact with living things

    Injury hospitalisations in 2024–25 increased by 22.7%, to an ASR of 270.5 per 100,000

    (compared to the previous 5-year average)

  • Falls

    Injury hospitalisations in 2024–25 increased by 11.6%, to an ASR of 1,103.3 per 100,000

    (compared to the previous 5-year average)

  • Assault

    Injury hospitalisations in 2024–25 decreased by 1.2%, to an ASR of 784.4 per 100,000

    (compared to the previous 5-year average)

  • Intentional self-harm

    Injury hospitalisations in 2024–25 decreased by 7.9%, to an ASR of 279.8 per 100,000

    (compared to the previous 5-year average)

In 2023–24, the age-standardised injury death rate among First Nations people rose by 11.2% to 86.7 per 100,000 (701 deaths) compared to the 2018–19 to 2022–23 average.