Ranked causes
In 2024–25, the leading causes of injury hospitalisations were (Figure 4):
- falls (253,800 hospitalisations or 926.1 per 100,000 population)
- contact with objects (82,283 cases or 300.3 per 100,000 population)
- transport (66,890 cases or 244.1 per 100,000 population)
In 2023–24, the leading causes of injury deaths were (Figure 5):
- falls (6,722 deaths or 25.0 per 100,000 population)
- suicide (3,316 deaths or 12.3 per 100,000 population)
- accidental poisoning (1,597 deaths or 5.9 per 100,000)
Figure 4: Injury hospitalisations by cause of injury, 2024–25
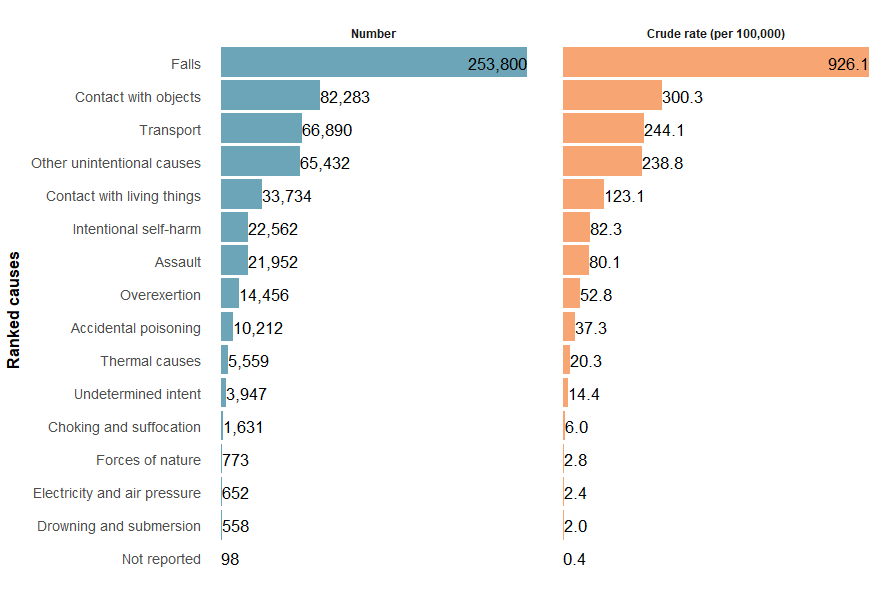
Note: Numbers and crude rates of hospitalisations (per 100,000 population) are represented by ranked rows.
Sources: AIHW National Hospital Morbidity Database and ABS National, state and territory population.
Figure 5: Injury deaths by cause of injury, 2023–24
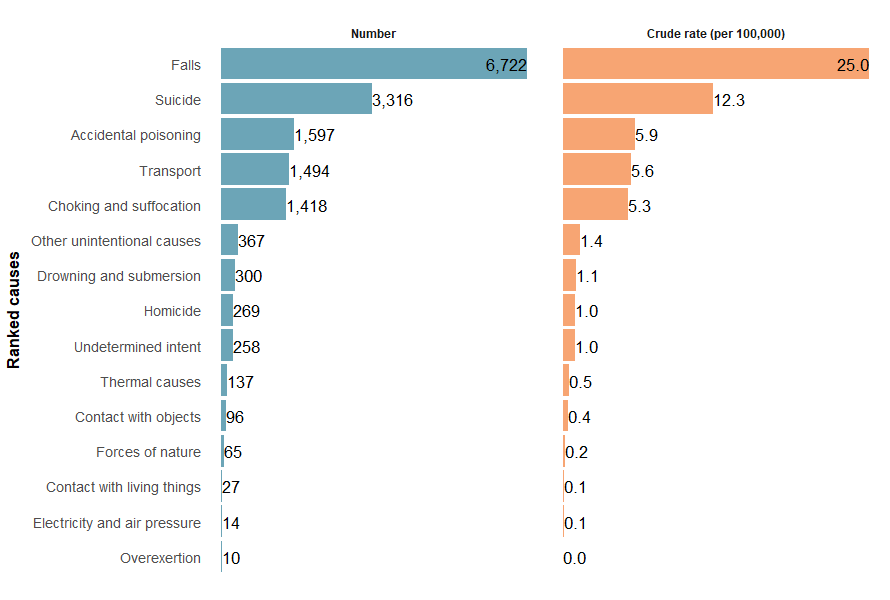
Note: Numbers and crude rates of deaths (per 100,000 population) are represented by ranked rows.
Sources: AIHW National Mortality Database and ABS National, state and territory population.
For more detail, see Supplementary data tables H2 and D2.