Injury trends
Emergency Department presentations
Between 2018–19 and 2024–25, rates of emergency department (ED) presentations for injury decreased by an annual average of 1.9%, with rates ranging from 7,609.2 in 2018–19 to 6,677.1 per 100,000 in 2024–25 (Figure 1). The presentation rate for injuries to EDs in 2024–25 was 5.0% lower than the previous 5-year average rate of 7,030.6 per 100,000 population.
The number of ED presentations for injury decreased over the same period. However, in the last 4 years, ED presentations for injury have increased, with about 25,000 more presentations in 2024–25 compared to 2021–22.
Figure 1: ED presentations for injuries, 2018–19 to 2024–25
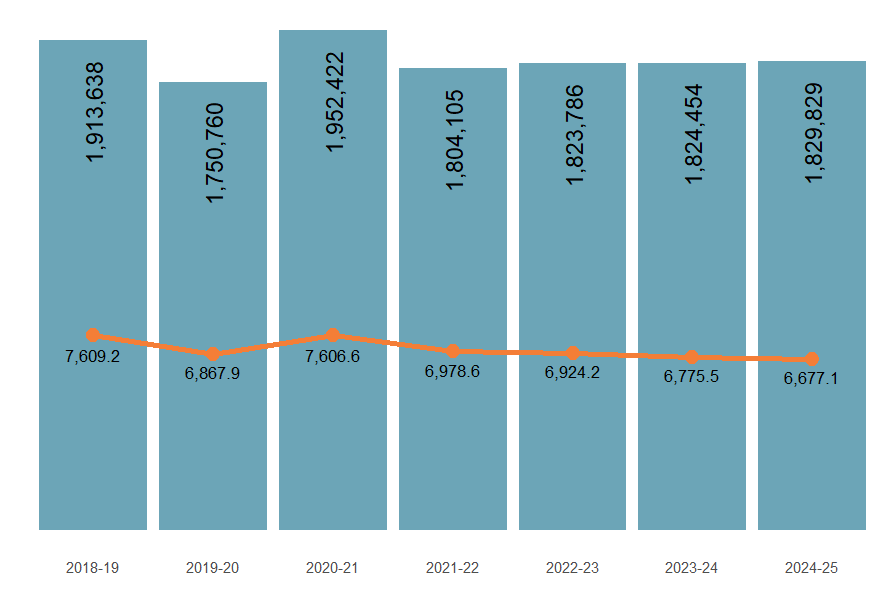
Note: Columns are case counts, while the line graph represents crude rates per 100,000 population.
Sources: AIHW National Non-admitted Patient Emergency Department Care Database and ABS National, state and territory population.
Injury hospitalisations
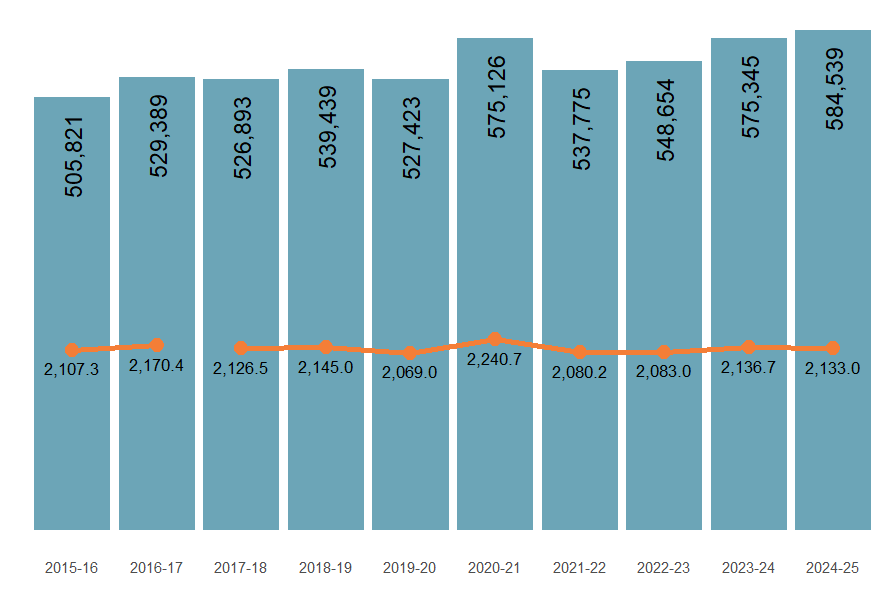
Over the past decade, hospitalisations from injury have remained relatively stable, with rates ranging from 2,069 to 2,240.7 per 100,000 persons in the last decade. During the same period, the number of injury hospitalisations rose from 505,821 to 584,539. The noticeable fluctuation in hospitalisation cases seen between 2020 and 2022 is likely due to disruptions caused by COVID-19 (Figure 2).
Figure 2: Injury hospitalisations by financial year, 2015–16 to 2024–25
Notes:
- Columns are case counts, while the line graph represents crude rates per 100,000 population.
- Break in series between 2016–17 and 2017–18. See technical notes for detail.
Sources: AIHW National Hospital Morbidity Database and ABS National, state and territory population.
Injury deaths
Over the past decade, deaths from injury have slightly increased, with rates ranging from 54.2 per 100,000 persons in 2014–15 to 58.5 in 2023–24, an average annual increase in the death rate of 0.9% (Figure 3). During the same period the number of injury deaths rose from 12,808 to 15,765.
Figure 3: Injury deaths by financial years, 2014–15 to 2023–24
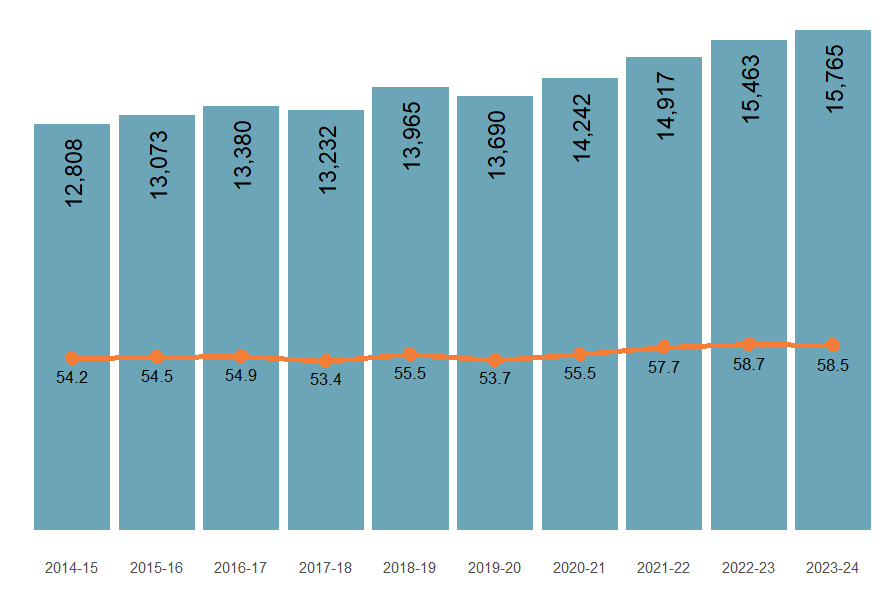
Note: Columns are case counts, while the line graph represents crude rates per 100,000 population.
Sources: AIHW National Mortality Database and ABS National, state and territory population.
For more details, see Supplementary data tables E1, H3 and D3.