Emergency department presentations
How do people get to and leave Emergency Departments?
How a person arrives at and departs from an emergency department (ED) can provide information about the severity of their presentation. Presentations to ED are categorised into three arrival modes:
- Ambulance, air ambulance or helicopter rescue service
- Police/correctional services vehicle
- Other (includes people who either walked into ED, or came by private transport, public transport, or taxi)
In 2024–25, Other was the most common form of arrival to ED with an injury (78.8% or 1,441,624 cases), followed by Ambulance, air ambulance or helicopter rescue service at 377,407 cases (20.6%) (Figure 6). Comparing to the corresponding proportions for all ED presentations (72.7% for Other and 26.6% for Ambulance in 2024–25), injury presentations were less likely to arrive to an ED by ambulance services.
In 2024–25, 77.5% of ED presentations for injuries departed without being admitted or referred to another hospital. A moderate proportion of presentations for injuries did require further hospital treatment, with 18.2% being admitted to the same hospital they presented to.
Figure 6: ED presentations for injury by arrival mode and episode end status, 2024–25
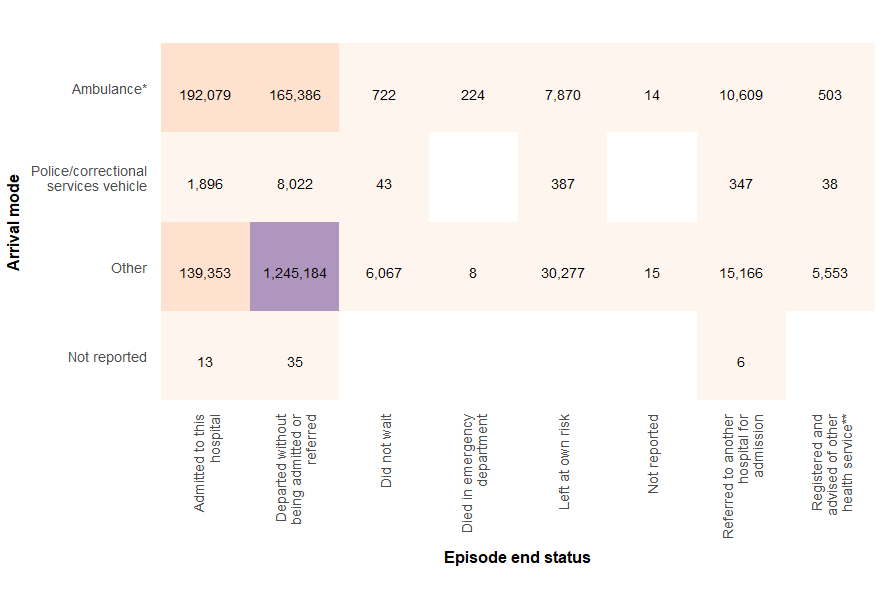
Notes:
1. Cells contain numbers of injury related ED presentations, by arrival mode and episode end status.
* 'Ambulance' includes air ambulance and helicopter services
** In these cases, the person was registered, advised of another health care service, and left without being attended to.
Source: AIHW National Non-admitted Patient Emergency Department Care Database.
When do injuries present to Emergency Departments?
In 2024–25 (Figure 7):
- injury presentations to ED peaked in December at 161,918 cases
- presentations at nighttime (18:00 to 06:00) were more common in summer months, and peaked on January 1st
- weekends were generally busier than weekdays. Sunday (15.8% of presentations) followed by Saturday (15.5% of presentations) were the busiest days of the week for injury presentations to ED
- patients tended to present to ED for injury during the day (business hours) with a peak in the afternoon around 4pm. Most presentations (77%) occurred between 8am and 8pm daily. On average, 4am was the quietest time of day.
Figure 7: ED presentations for injury, by date, month, day of the week and hour of the day, 2024–25
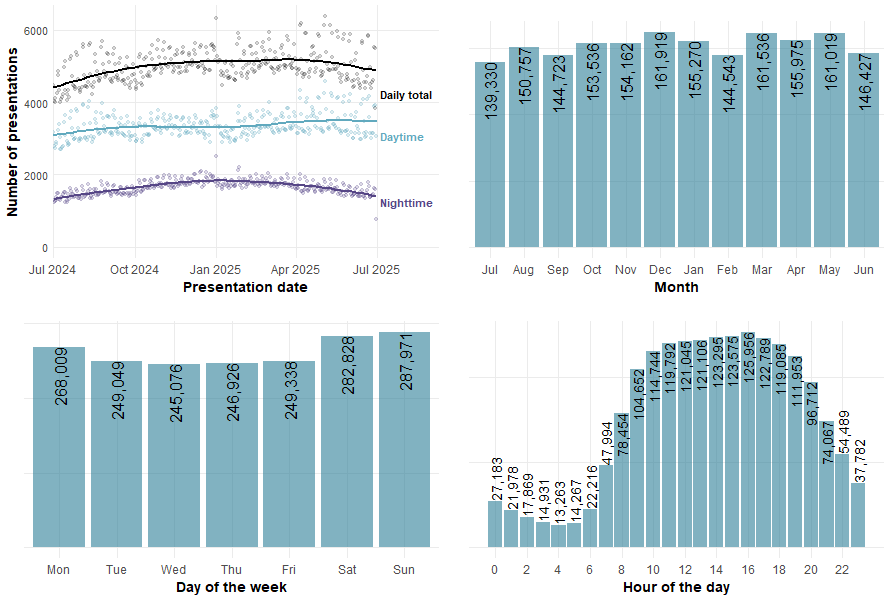
Note: Top left panel: Daytime is 06:00 to 17:59, nighttime is 18:00 to 05:59.
Source: AIHW National Non-admitted Patient Emergency Department Care Database.
Urgency of care
Every presentation to an ED is assigned one of 5 triage categories based on the urgency with which the person requires assistance (Table 1).
Category | Description | Response |
|---|---|---|
1- Resuscitation | Immediately life threatening | Immediate simultaneous assessment and treatment |
2 - Emergency | Imminently life threatening OR Important time critical treatment OR Very severe pain | Assessment and treatment within 10 minutes |
3 - Urgent | Potentially life threatening OR Situational urgency OR Humane practice mandates the relief of severe discomfort or distress within 30 minutes | Assessment and treatment start within 30 minutes |
4 - Semi-urgent | Potentially serious OR Situational urgency OR Significant complexity or severity OR Humane practice mandates the relief of discomfort or distress within one hour | Assessment and treatment start within 60 minutes |
5 - Non-urgent | Less urgent OR clinic-administrative problems | Assessment and treatment start within 120 minutes |
The bulk of injury ED presentations were triaged as semi-urgent (Table 2). In 2024–25, out of the 1.8 million ED presentations for injury, almost half (48.6%) were triaged as semi-urgent and a further 9.2% as non-urgent. This was higher than the proportion of ED presentations for all conditions that were semi-urgent (33.6%) or non-urgent (6.1%), indicating that injuries that presented to ED were generally less severe than presentations overall.
Triage category | Number of injury presentations | Percentage (%) | Corresponding percentage of all ED presentations (%)* |
|---|---|---|---|
Resuscitation | 18,690 | 1.0 | 1.0 |
Emergency | 206,460 | 11.3 | 17.7 |
Urgent | 547,719 | 29.9 | 41.7 |
Semi-urgent | 888,728 | 48.6 | 33.6 |
Non-urgent | 168,194 | 9.2 | 6.1 |
Total | 1,829,829 | 100.0 | 100.0 |
Notes:
* calculated from Supplementary data table 4.2, Emergency department presentations, by triage category and arrival mode, states and territories, 2024–25, MyHospitals Emergency department Care 2024–25 data tables.
1. Due to rounding, column percentage totals may not sum to 100%.
Sources: AIHW National Non-admitted Patient Emergency Department Care Database.
Over the last 7 years from 2018–19, the rates of ED presentations by triage category have fluctuated, with presentations triaged as Emergency rising and those triaged as Semi-urgent and Non-urgent falling over time (Figure 8).
Figure 8: ED presentations for injury by triage category, 2018–19 to 2024–25
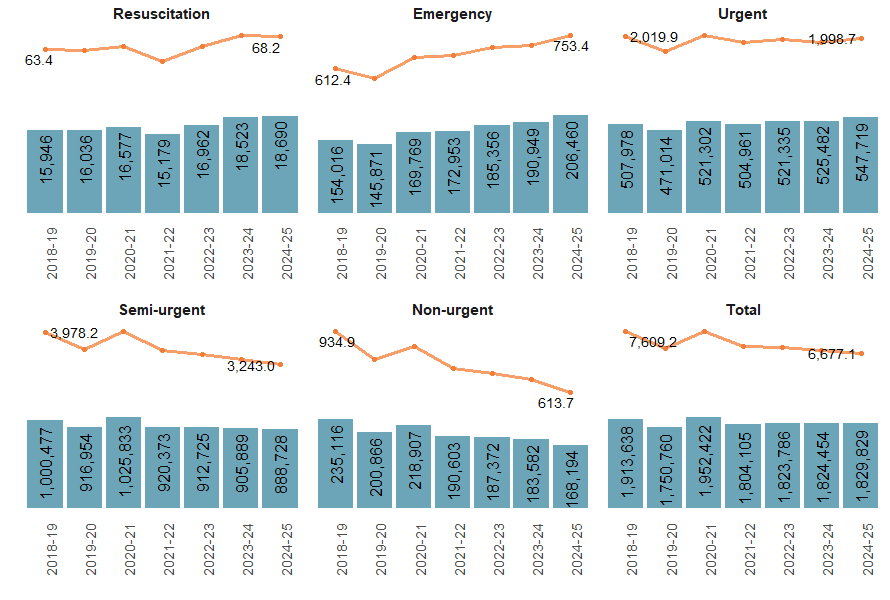
Note: Columns are case counts, line graphs present age-standardised rate per 100,000 population.
Sources: AIHW National Non-admitted Patient Emergency Department Care Database, state and territory population.
Semi-urgent presentations are the most common across all age groups but have decreased over time, with working age adults having the lowest rates of Semi-urgent injury presentations to ED (Figure 9). In contrast, Emergency injury presentation rates have increased for all age groups, with the largest increases recorded in people aged 14 and under.
Figure 9: ED presentations for injury by triage category, sex and age group, 2018–19 to 2024–25
Figure 9 shows that the highest rate of ED presentation is among 0 to 4 year olds, and that most presentations are triaged as Semi-urgent for all age groups.

Figure 10: ED presentations for injury by triage category and type of injury, 2018–19 to 2024–25
Figure 10 is a line chart showing the crude rate of injury ED presentations by triage category and injury type. Most injury types are most commonly triaged as Semi-urgent.

Waiting times
In 2024–25:
- 50% of patients who presented to ED for injury were seen within 18 minutes. This waiting time was equal to the average waiting time for patients who presented to ED for all types of conditions (18 minutes)
- 90% of injury patients were seen within 1 hour and 55 minutes, a similar waiting time to 1 hour and 58 minutes for patients who presented to ED for any type of condition
- 71.8% of patients treated in ED for injury were ‘seen on time’, compared with 67.1% of patients treated in ED for all conditions.
Over the last 7 years, the overall proportion of injury ED presentations seen on time has decreased, as has the comparable proportion for all conditions. In each year over the same period, those presenting to ED for injuries were slightly more likely to be seen on time than those for all conditions (Figure 11).
Figure 11: Median and 90th percentile waiting time (minutes) of ED presentations and proportion seen on time, 2018–19 to 2024–25
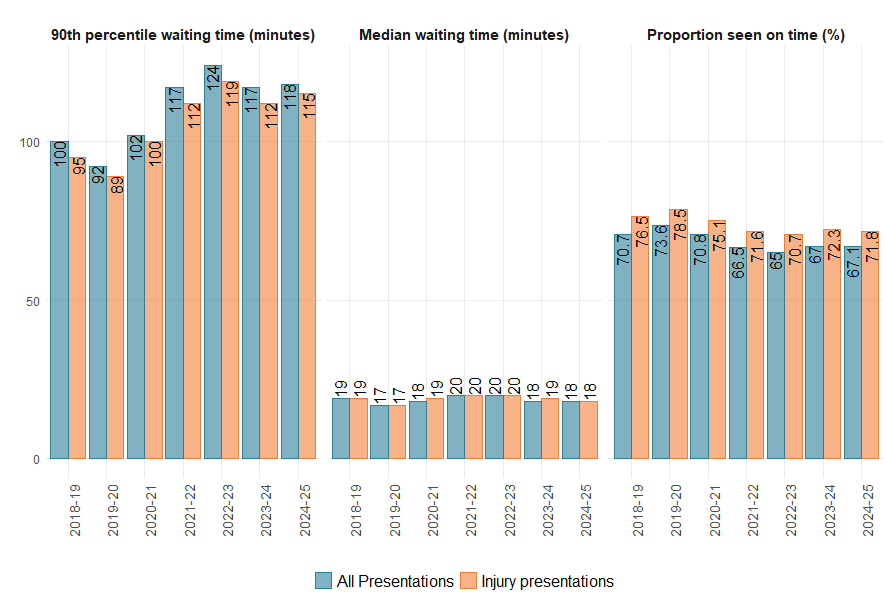
Notes:
- Median waiting time is equivalent to the time within which 50% of patients were seen; 90th percentile waiting time is equivalent to the time within which 90% of patients were seen.
- Data relate to presentations with a type of visit of Emergency presentation only.
Sources: AIHW National Non-admitted Patient Emergency Department Care Database, state and territory population.