Hospitalisations
There are many ways that the severity, or seriousness, of an injury can be measured. Some of the ways to measure the severity of hospitalised injuries are:
- number of days in hospital (length of stay)
- time in an intensive care unit (ICU)
- time on a ventilator
- in-hospital deaths.
Average length of hospital stay
The most severe injuries in 2024–25 as measured by average length of stay in hospital were due to thermal causes (4.9 days), falls (4.8 days) and transport (3.4 days) (Figure 12).
Figure 12: Average length of stay (days) by injury cause and sex, 2024–25
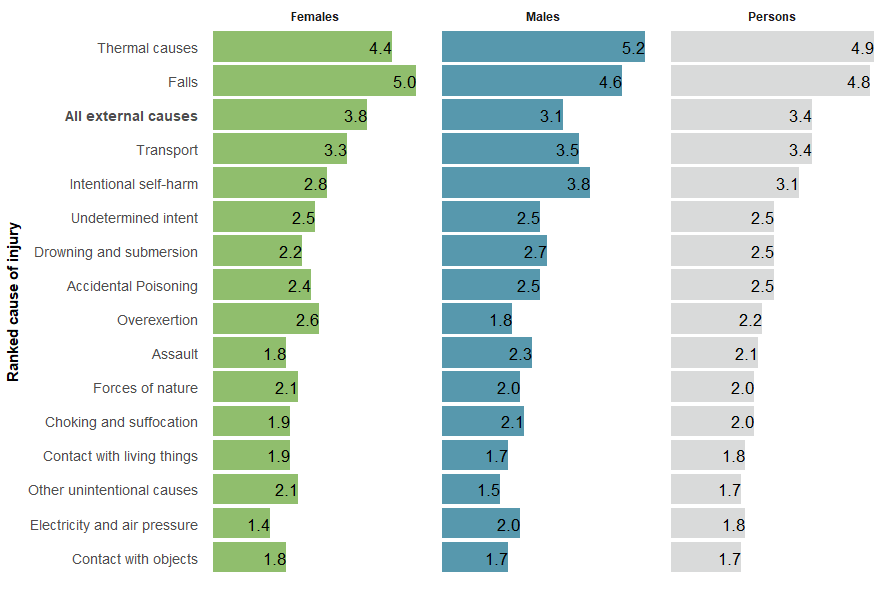
Source: AIHW National Hospital Morbidity Database
For the most severe injury types, average hospital stays were 6.0 days for internal organ injuries, 5.6 days for intracranial injuries, and 5.0 days for burns.
The longest average length of stay for males was for intracranial injuries (6.0 days), and for females was for internal organ injuries (6.6 days) (Figure 13).
Figure 13: Average length of hospital stay (days) by injury type and sex, 2024–25
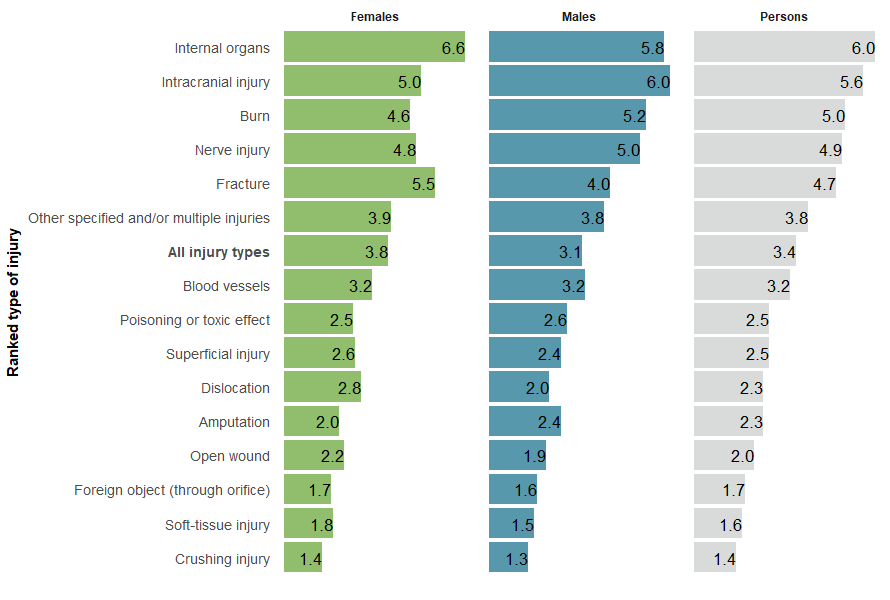
Source: AIHW National Hospital Morbidity Database.
ICU, CVS and in-hospital deaths
An intensive care unit (ICU) is a designated ward of a hospital which is specially staffed and equipped to provide observation, care and treatment to patients with actual or potential life-threatening illnesses, injuries or complications, from which recovery is possible (METEOR 2018).
In the ICU, patients may need continuous ventilatory support (CVS), or ‘life support’, when a patient breathes via an artificial airway with the aid of a machine.
In 2024–25: