Health costs avoided from being physically active
Physical activity has many health benefits, and reduces the risk of developing various chronic health conditions. This component of work aims to quantify the health system costs that are avoided through the reduction in disease burden from participation in physical activity.
The estimates presented in this section provide an update on previously published preliminary estimates. They include the benefits to health that are due to the previously modelled conditions linked to physical inactivity, additional directly linked conditions (depression, anxiety and falls), and those that are affected through intermediate risk factors.
Box 2: How is the benefit of physical activity estimated?
These estimates are calculated by comparing the level of activity that was undertaken in 2018, the disease risk associated with those activity levels relative to the lowest risk level, and the disease risk for those undertaking no activity. This differs from the cost of inactivity section by additionally comparing activity risks to the highest risk category (doing no activity), rather than only the lowest risk category. This provides an indication of the benefit of physical activity.
For more details on how these estimates are derived, refer to Methods and data sources.
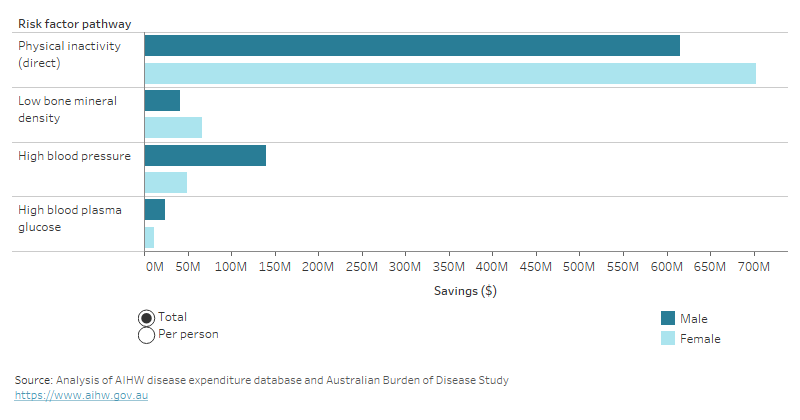
Through this method, it was estimated that participation in physical activity saved the health system $1.7 billion in 2018-19 (Figure 7). The benefit of physical activity can be interpreted as the difference between the costs associated with current levels of inactivity in Australia ($2.4 billion) and the expected physical inactivity costs if the whole population was sedentary.
The benefit for males and females was similar ($820 million for males, and $831 million for females). Most of the indirect benefits were through improved blood pressure ($190 million) and bone mineral density ($108 million). For males, most of the indirect benefit was through blood pressure ($141 million), while for females most of the indirect benefit was through bone mineral density ($67 million).
Figure 7: Total health savings due to participation in physical activity by risk factor pathway and sex, 2018-19
Alt text: Bar chart showing the total and per person cost savings for each risk factor pathway due to participation in physical activity in 2018-19. Savings were higher for males for high blood pressure and high blood plasma glucose, while savings were higher for females for direct effects and for bone mineral density.
For more detail, see data tables.
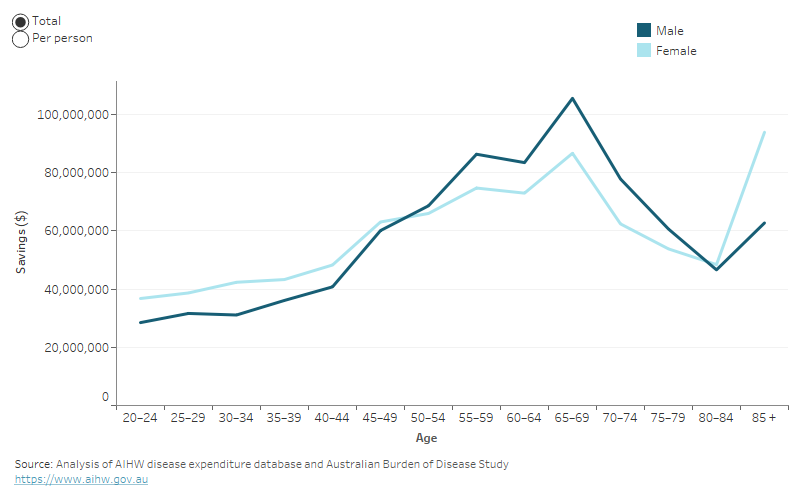
On average per person, around $70 of health spending was avoided on conditions directly linked to physical inactivity, $10 was avoided due to blood pressure, and $6 was avoided due to low bone mineral density. Savings per person from reductions in blood pressure due to physical activity for males ($15) were almost three times that of females ($5) (Figure 5). Total health costs avoided increased with age and were greatest for males and females after 45 years of age (Figure 8).
Figure 8: In 2018-19, health savings per person were highest directly due to participation in physical activity compared to indirectly via other risk factors
Alt text: The line graph shows total and per person savings by age group and sex in 2018-19. Savings where higher for females between ages 20 to 49, while savings were higher for males between ages 50 to 84.
For more detail, see data tables.
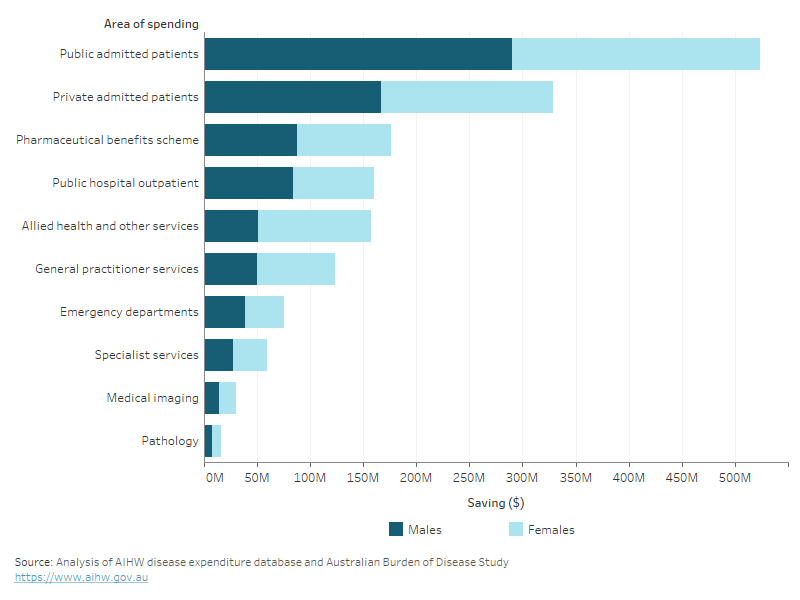
Health costs avoided from physical activity are greatest for public and private admitted patients ($524 million and $329 million, Figure 9), and hospital admissions would reflect more severe injuries compared to more minor injuries treated by primary care providers.
Figure 9: Total health savings were greatest for public and private admitted patients, 2018-19
Alt text: This stacked bar chart shows savings due to physical activity for males and females in each area of the health system. Savings were highest in hospitals.
For more detail, see data tables.
Conditions prevented
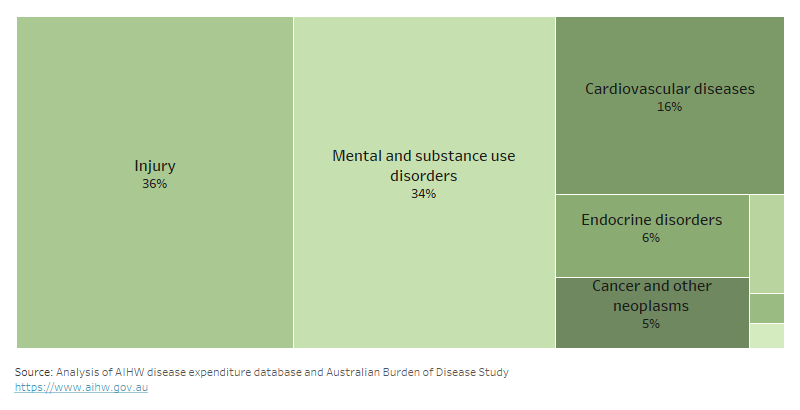
The majority of health spending avoided through participation in physical activity related to injury (36%, both directly from falls prevented, and through fractures from low bone mineral density, Figure 10). This was followed by mental and substance use disorders (34%), and cardiovascular diseases (16%).
Figure 10: Total savings from physical activity, by burden of disease group, 2018-19
Alt text: Stacked bar chart showing spending for each risk factor pathway and linked condition for males and females.
For more detail, see data tables.
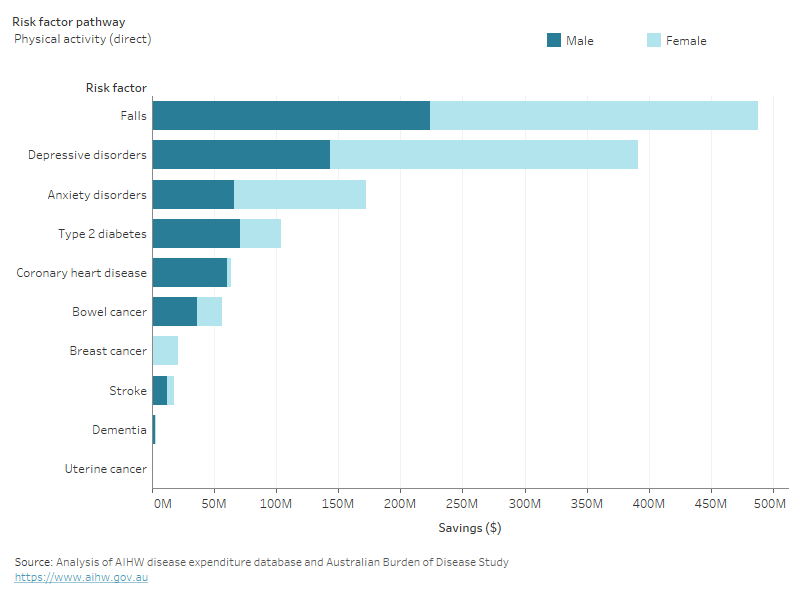
From directly associated conditions, physical activity prevented the most spending on falls ($488 million), depression ($392 million), and anxiety ($173 million, Figure 11). The improvements in mental health were higher for females than males.
Through blood pressure, savings were highest for coronary heart disease ($82 million), atrial fibrillation and flutter ($34 million), and stroke ($21 million).
Through fasting plasma glucose, savings were highest for coronary heart disease ($7 million), cataract ($6 million), and peripheral vascular disease ($5 million).
Through low bone mineral density, savings were highest for other fractures ($50 million), hip fracture ($37 million), and tibia and ankle fracture ($13 million).
Figure 11: Avoided spending from physical activity on conditions through each risk factor pathway, by sex, 2018-19
Alt text: Stacked bar chart showing spending for each risk factor pathway and linked condition for males and females.
For more detail, see data tables.


