Cost of injuries
On this page
Physical activity is associated with a range of health benefits, which have flow-on effects in terms of avoided health spending. On the other hand, physical activity can also be associated with injuries that have both acute and long-term health impacts that are associated with health spending.
The costs associated with injuries estimated in this report are assumed to reflect a preventable burden, in that the costs captured here reflect post-injury care rather than injury prevention activities, with the assumption that all injuries related to physical activity are potentially preventable (through improved prevention and injury management activities rather than avoiding activity). The cost of injuries presented in this report reflect injuries from all types of physical activity, not only ‘sport related’ injuries.
Injury treatment costs in this section are derived from the AIHW disease expenditure database, and includes hospital services, primary health care services and referred medical services. This analysis estimated that $1.2 billion was spent treating injuries caused by physical activity. For further details on the data used in this section and how these estimates were derived, refer to the Technical Notes and Economics of sports injury.
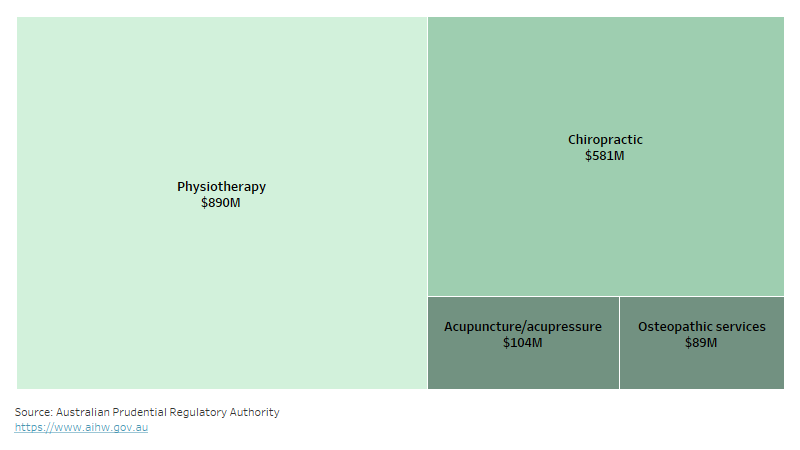
Injury treatment also occurs through other areas of the health system (see Other sources of treatment and management), including physiotherapy, chiropractic, acupuncture/acupressure and osteopathic services. In 2018-19, a total of $1.7 billion was spent on these services using private health insurance, though costs associated with these services are currently not able to be specifically attributed to injury versus other conditions.
This analysis includes estimates of the costs of osteoarthritis due to a prior physical activity related injury (see Long term costs), representing the first estimates of the long-term consequences of physical activity injuries in Australia.
Acute costs
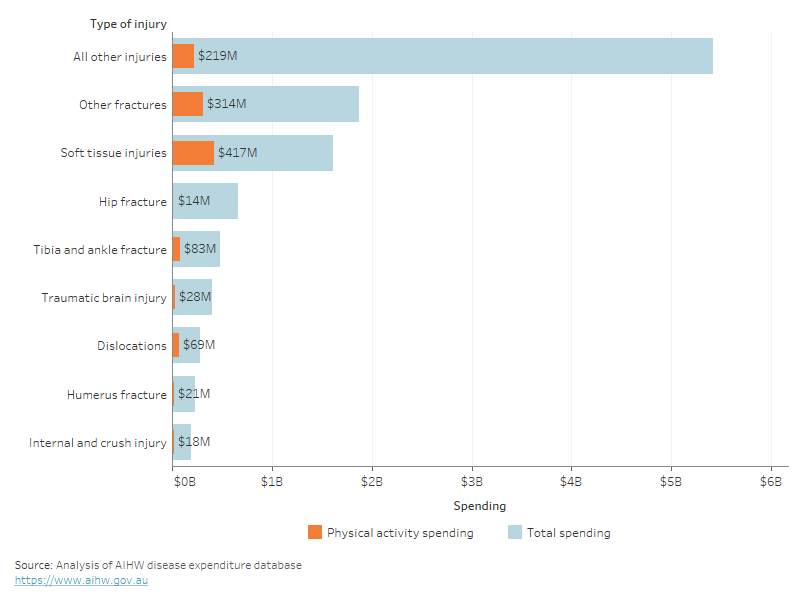
In 2018–19, total health spending was estimated at $195.4 billion, approximately $7,764 per person (AIHW 2021). Total injury spending was $11.2 billion (Figure 12). This analysis estimated that $1.2 billion was spent treating injuries caused by physical activity (around 11% of total injury spending). This includes spending across hospital services, primary health care services and referred medical services.
Around a quarter of this spending was for soft tissue injuries ($416 million), followed by other fractures ($313 million), and tibia and ankle fractures ($83 million).
The injury types with the highest proportion of total spending due to physical activity were soft tissue injuries (26%), dislocations (24%), and tibia and ankle fractures (17%).
Figure 12: Total spending and cost due to physical activity, by injury type, 2018-19
Alt text: Bar chart showing total injury spending and spending due to physical activity by injury type. Spending due to physical activity was highest for soft tissue injuries ($417 million).
For more detail, see data tables.
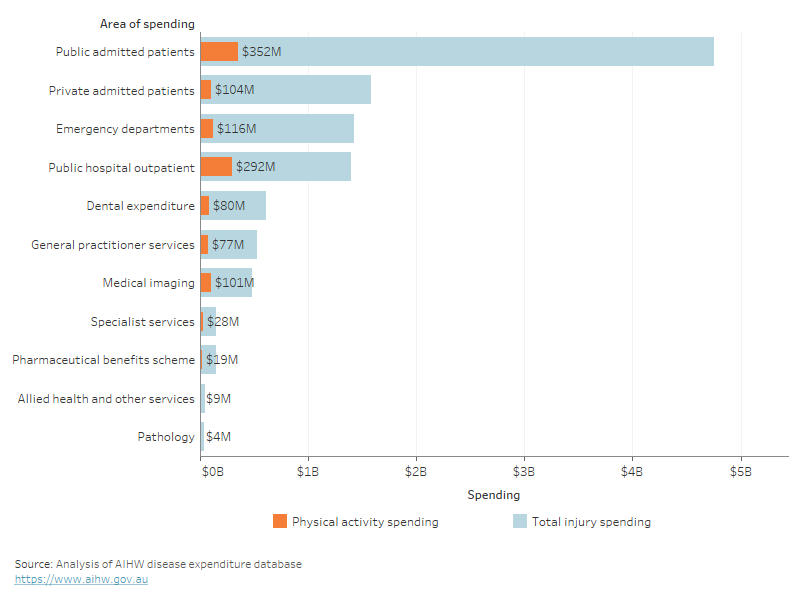
Spending for public hospital admitted patients accounted for almost a third of all physical activity related injury spending ($352 million), followed by outpatient clinics ($292 million) and emergency departments ($116 million, Figure 13). The areas with the greatest proportion of total injury costs due to physical activity were public hospital outpatient (21%), medical imaging (21%), and allied health and other services (20%).
Figure 13: Physical activity related injury spending, total injury spending, and percent of total due to physical activity, by area of spending, 2018-19
Alt text: Bar chart showing total injury spending and spending due to physical activity by area of spending. Spending from physical activity related injuries was highest for public admitted patients ($352 million).
For more detail, see data tables.
Spending on physical activity related injuries was higher for males ($686 million) than females ($415 million, Figure 14). Spending was higher for younger age groups at around $90 to $100 million between the ages of 10 and 30. In these age groups, spending for males was around double the spending for females. Further information on patterns of physical activity related injury spending are reported in Economics of sports injury.
Figure 14: Total physical activity related injury spending by age and sex, 2018-19
Alt text: Bar chart showing total spending from physical activity related injuries, by age and sex. Injury spending was higher for males than females in all age groups except 85+.
For more detail, see data tables.
Activity type
Specific activities at time of injury are only available for hospital admitted patients. The grouping of activities presented in this analysis are based on the sports reported in the Australian Sports Commission’s AusPlay survey and are consistent with those in Sports Injury in Australia. Further information about the number and rate of injuries by activity type is available in this report.
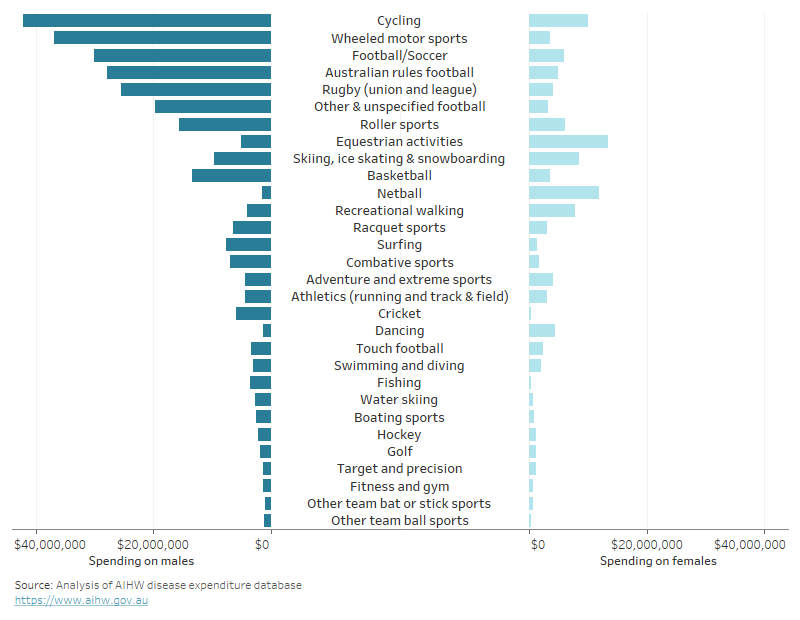
The specific type of physical activity with the highest spending for hospital admissions was cycling ($52 million), followed by wheeled motor sports ($40 million) and football/soccer ($36 million, Figure 15).
The types of activities contributing to admitted patient injury costs varied for males and females. For males, the most spending was associated with cycling ($42 million), wheeled motor sports ($37 million) and football/soccer ($30 million). For females, this was equestrian activities ($13 million), netball ($12 million) and cycling ($10 million).
Figure 15: Spending by type of physical activity for males and females, 2018-19
Alt text: Bar chart showing total hospitalised injury spending for males and females by type of activity. Spending was highest for cycling ($51 million) and lowest for other team ball sports ($1.6 million).
For more detail, see data tables.
Accounting for participation rates
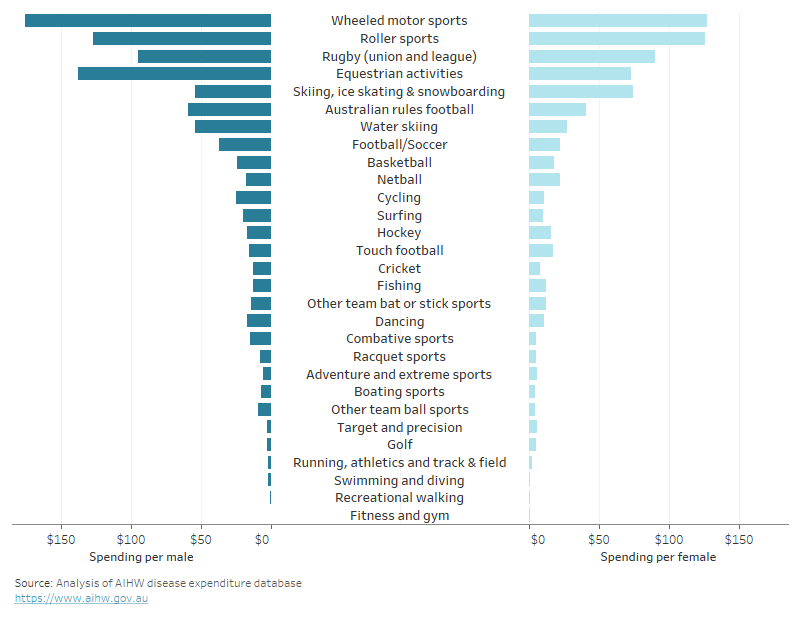
Activities with the highest participation rates were recreational walking, fitness and gym, and athletics (running and track & field). These activities were associated with very low levels of admitted patient injury spending, all around $2 or lower per participant in 2018-19. Along with swimming and diving, these activities had the lowest per participant cost of all specified categories.
Activities with the highest admitted patient spending per participant were wheeled motor sports ($170), roller sports ($127), and rugby (union and league) ($95) Figure 16).
Figure 16: Injury spending per participant, by type of activity, 2018-19
Alt text: Bar chart showing average hospitalised injury cost per participant, for males and females. Spending per participant was highest for wheeled motor sports ($170), and lowest for fitness and gym ($0.25).
For more detail, see data tables.
Other sources of treatment and management
The disease expenditure database does not include costs for allied health where the service was not funded through the MBS. Some of this information is available through the Australian Prudential Regulation Authority for private health insurance claims. Due to data availability, this does not include age, sex, or condition being managed. Spending estimates for private health insurance include both out of pocket costs and benefits paid.
Physiotherapy, chiropractic, acupuncture/acupressure, and osteopathic services are commonly used to treat sports injuries, and $1.7 billion was spent on these services through private health insurance in 2018-19 (Figure 17). Almost $900 million was spent on physiotherapy. However, a range of issues other than physical activity and sport related injuries are treated and managed in these settings so spending on these services is not necessarily related to sports injuries.
Figure 17: Spending on allied health services through private health insurance, 2018-19.
Alt text: Figure showing the total spending on allied health services that are claimed through private health insurance. Physiotherapy cost $890 million, followed by chiropractic ($581 million), acupuncture/acupressure ($104 million), and osteopathic services ($89 million).
For more detail, see data tables.
Long term costs
Injuries are known to contribute to the development of chronic musculoskeletal disorders (such as osteoarthritis). In many cases this burden might be prevented through improved injury prevention activities such as improved physical training exercises and routines and/or changes to rules, policies, and use of protective equipment.
This analysis has attempted to quantify the costs associated with osteoarthritis following a physical activity related injury. These estimates are modelled, and are indicative only. A study by Brown et al, 2006, was conducted in the US to estimate the incidence, prevalence and burden of post-traumatic osteoarthritis. They estimate that 12% of all osteoarthritis is due to previous trauma, predominantly fractures. This was used to estimate post-traumatic osteoarthritis costs in Australia. Australian data on the proportion of fractures that were due to physical activity was used to allocate the total post traumatic osteoarthritis cost (from all types of injury) to physical activity. Due to data limitations, this was unable to be reported by location of osteoarthritis.
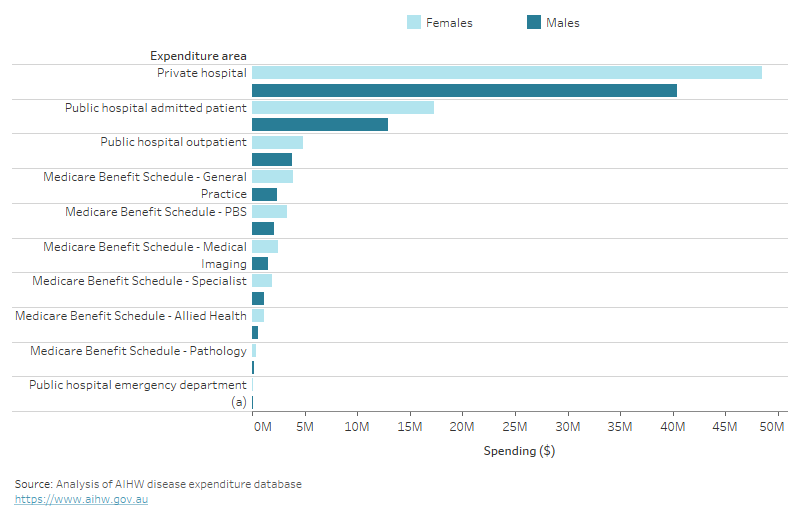
These estimates indicate that around $150 million of spending on osteoarthritis in 2018-19 was due to previous physical activity injury (Figure 18). This was slightly higher for females ($84 million) than males ($65 million). Most of the spending related to private hospitals ($89 million), public admitted patients ($30 million) and public hospital outpatient clinics ($9 million).
Figure 18: Spending on osteoarthritis due to prior physical activity related injury, by sex and area of health system spending, 2018-19.
Alt text: Bar chart showing spending due to osteoarthritis from prior physical activity related injuries for males and females, in each area of the health system. Spending was higher for females ($84 million) than males ($65 million).
For more detail, see data tables.
References
Brown, TD, Johnston, RC, Saltzman, SL, Marsh, JL, Buckwalter, JA. Posttraumatic Osteoarthritis: A First Estimate of Incidence, Prevalence, and Burden of Disease. J Orthop Trauma 2006;20:739–744.


