Total cost of physical inactivity and related risk factors
Health risk factors are attributes, characteristics or exposures that increase the likelihood of a person developing a disease or health disorder. In many cases, individuals can modify risk factors such as smoking, sun exposure or physical inactivity. Biomedical risk factors (for example overweight) are bodily states that are often influenced by behavioural risk factors. Physical inactivity is an important behavioural risk factor for health that affects other biomedical risk factors including blood pressure, blood plasma glucose, and bone mineral density.
The estimates presented in this section provide an update on previously published preliminary estimates. This report estimates the cost of physical inactivity due to the previously modelled conditions (such as coronary heart disease and type 2 diabetes), additional directly linked conditions (depression, anxiety and falls), and those that are affected through intermediate risk factors.
Box 1: How is the cost of physical inactivity estimated?
These estimates are calculated using total spending on disease from the disease expenditure database, and the estimated proportion of disease burden that is due to a risk factor. Estimates of risk factor burden are calculated using exposure information (the level of physical activity that was undertaken in 2018 in Australia), and the relative risk of a disease for those with and without a risk factor compared to an ‘ideal’ exposure level with minimum risk for a disease. The cost for each disease is multiplied by the proportion of disease due to a risk factor (risk factor cost = disease cost x attributable fraction).
For more details on how these estimates are derived, refer to Methods and data sources.
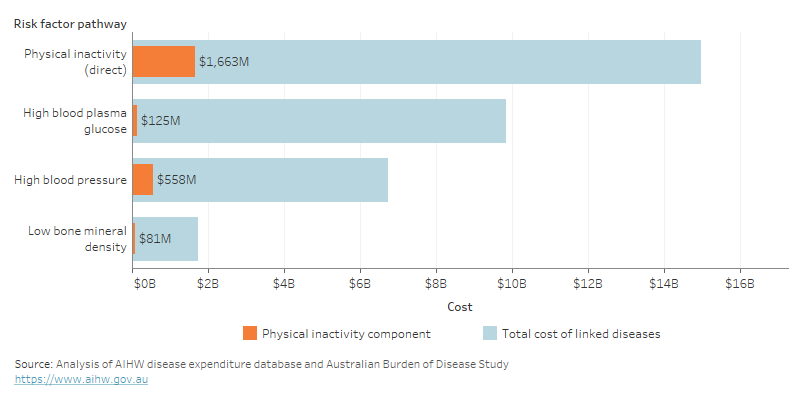
In 2018-19, a total of $2.4 billion was spent on health conditions due to physical inactivity (Figure 2). This included $1.7 billion directly from inactivity, and almost $763 million indirectly through other risk factors caused by inactivity. The majority of indirect spending was due to high blood pressure from insufficient physical activity ($558 million).
Figure 2: Direct and indirect cost of physical inactivity, and percent of total spending due to inactivity, 2018-19
Alt text: Bar chart showing the total cost and cost due to inactivity for conditions linked to inactivity directly, and for high blood plasma glucose, high blood pressure, and low bone mineral density.
For more detail, see data tables.
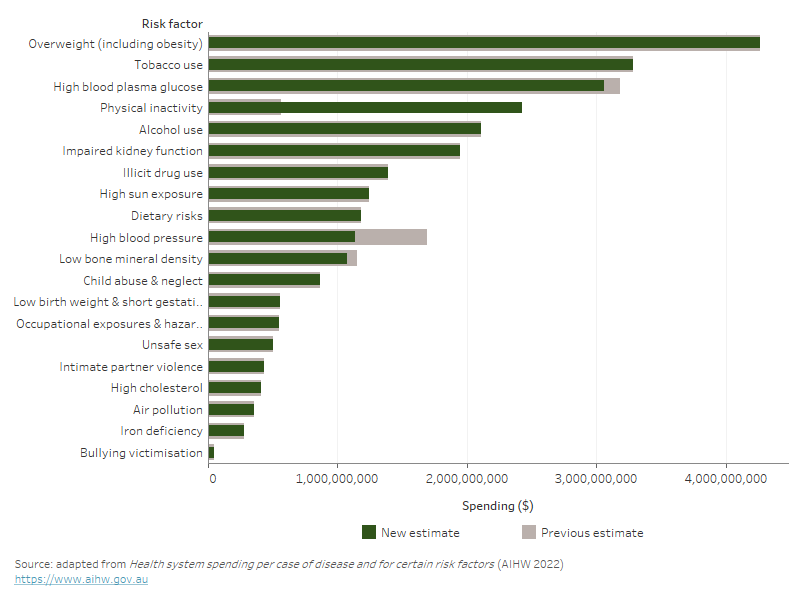
The inclusion of additional linked conditions and risk factors increased the previously estimated health system spending due to inactivity from $561 million to $2.4 billion (Figure 3), while decreasing spending on high blood plasma glucose, high blood pressure, and low bone mineral density. Physical inactivity increased from the 12th highest spending risk factor to the 4th highest. Note that estimates in this figure report physical inactivity spending that is due to intermediate risk factors as physical inactivity spending (instead of high blood pressure, for example). For other risk factor spending not due to physical inactivity, any spending due to intermediate risk factors is reported as spending from the intermediate risk factor (for example, dietary effects on cholesterol are reported under high cholesterol).
Figure 3: Total health system spending attributable to risk factors, Australia, 2018-19
Alt text: Bar chart showing previous and new estimates of the total cost of 20 risk factors. Physical inactivity increased to the 4th highest.
For more detail, see data tables.
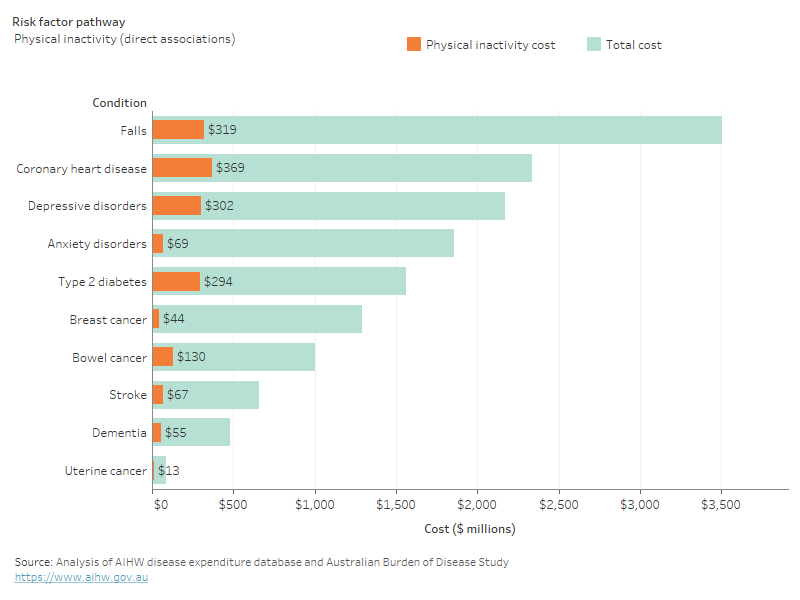
Of the ten conditions that are directly caused by physical inactivity, coronary heart disease had the highest spending ($369 million) followed by falls ($319 million) and depressive disorders ($302 million) (Figure 4). A further $260 million was spent on coronary heart disease from physical inactivity mediated through high blood pressure ($236 million) and high fasting plasma glucose ($23 million).
Physical inactivity was ultimately responsible for 27% of all spending on coronary heart disease, 21% of stroke, and 16% of hypertensive heart disease.
Figure 4: Spending on conditions linked to physical inactivity and related risk factors, millions, 2018-19
Alt text: bar chart showing costs of conditions linked to each risk factor that are due to physical inactivity.
For more detail, see data tables.
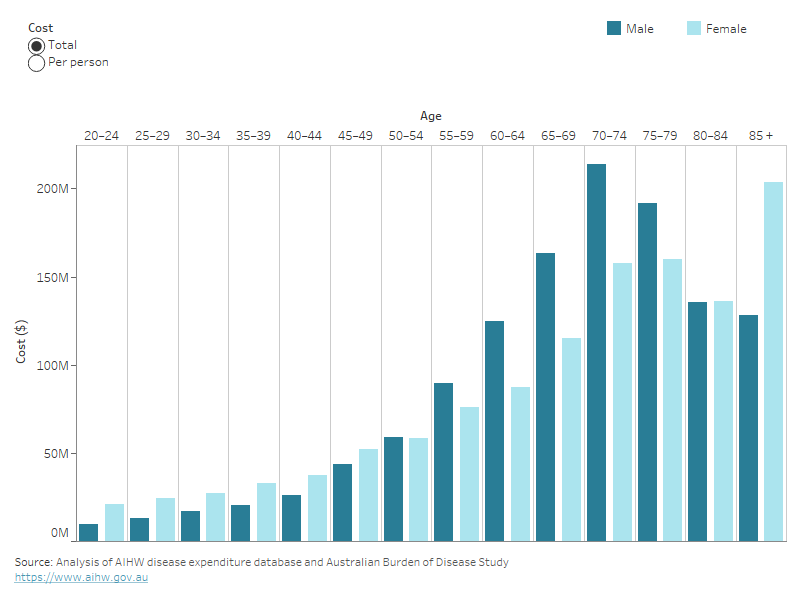
Total spending related to physical inactivity was about equal for males and females ($1.2 billion each). Spending due to inactivity is relatively stable between ages 20 to 44, and begins increasing from age 45 onwards. Physical inactivity spending was higher for females than males between ages 20 to 49. From 50 years and older, spending was higher for males than females (with the exception of those aged 85 and over) (Figure 5).
Spending per person was $123 for females, and $133 for males. Between the ages of 20 and 55, per person spending for males and females is relatively equal. From age 55 onwards, spending for males increases much more per person than for females (Figure 5).
Figure 5: Total physical inactivity related spending by age group and sex, 2018-19
Alt text: Chart showing total and per person spending due to physical inactivity by age and sex.
For more detail, see data tables.
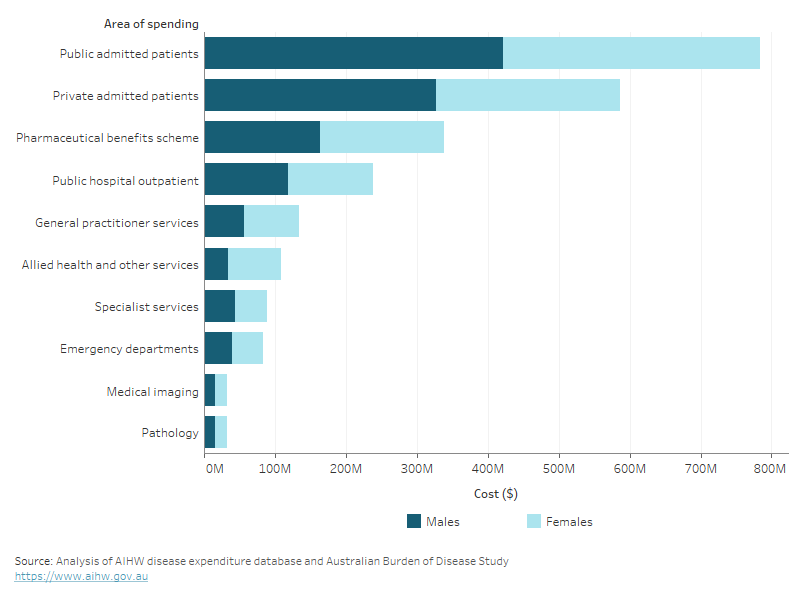
Spending on all physical inactivity related conditions was highest for admissions to public hospitals ($784 million), private hospitals ($586 million), and pharmaceuticals ($338 million, Figure 6).
Figure 6: Total physical inactivity related spending by area of spending and sex, 2018-19
Alt text: Stacked bar chart showing costs from physical inactivity for males and females in each area of the health system.
For more detail, see data tables.


