Disease/injury-specific summary
Use the interactive graphs to generate a summary of burden of disease in Australia in 2022 for a specific disease or injury (including COVID-19).
For the first time the Study includes estimates of disease burden due to COVID-19, using data available at the time of analysis. This included data on deaths, cases and hospitalisations up until August 2022. Given the dynamic and ongoing nature of the COVID-19 pandemic, these estimates may be revised in the future as more data become available. For a discussion of results related to specific diseases, such as coronary heart disease (the leading cause of disease burden in 2022) and COVID-19, refer to the Summary.
Use the drop-down list at the top right of the visualisation to view the data for a specific disease or injury
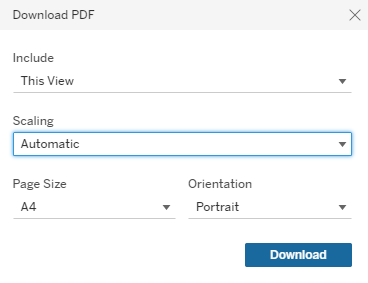
Click on the ‘Download PDF’ button to download a 1-page PDF for the selected disease/injury.

Select A4 in the Page Size drop-down.
Hover over the bars or lines on the charts for additional information.
The toolbar at the bottom of the visualisation enables users to interact with the data in different ways:
Undo = Undo the latest filter applied.
Redo = Redo the latest filter applied.
Revert = Clears all filters applied and reverts visualisation to default filters.
Refresh = Connects to the underlying data source and updates the visualisation with any changes in the data (not applicable to this visualisation).
Pause = Stops the visualisation from updating each time a filter is changed, enabling multiple filters to be changed at once. Clicking ‘Resume’ will update the visualisation according to the selected filters.
Share = Generates a link that can be shared (note that filters will not be applied when link is shared).
Download = Allows a downloadable file as either an image (PNG), PDF or PowerPoint file. This is a useful way to save a snapshot of the visualisation to include in a document or presentation.
Full screen = Displays the dashboard in full screen mode (press Esc to return to original view).
This interactive data visualisation reports a range of statistics on the burden of a specific disease or injury in Australia, which can be selected by the user. There are a number of sentences reporting the amount and rate of total, fatal and non-fatal burden due to the disease or injury in 2022; the proportion of total burden in 2022 which is due to fatal and non-fatal burden; and the age-standardised rates of total, fatal and non-fatal burden by sex and year (2003, 2011, 2015, 2018 and 2022). There are 4 column charts showing the amount and rate of total burden for males and females by 5-year age groups in 2022.