Health-adjusted life expectancy
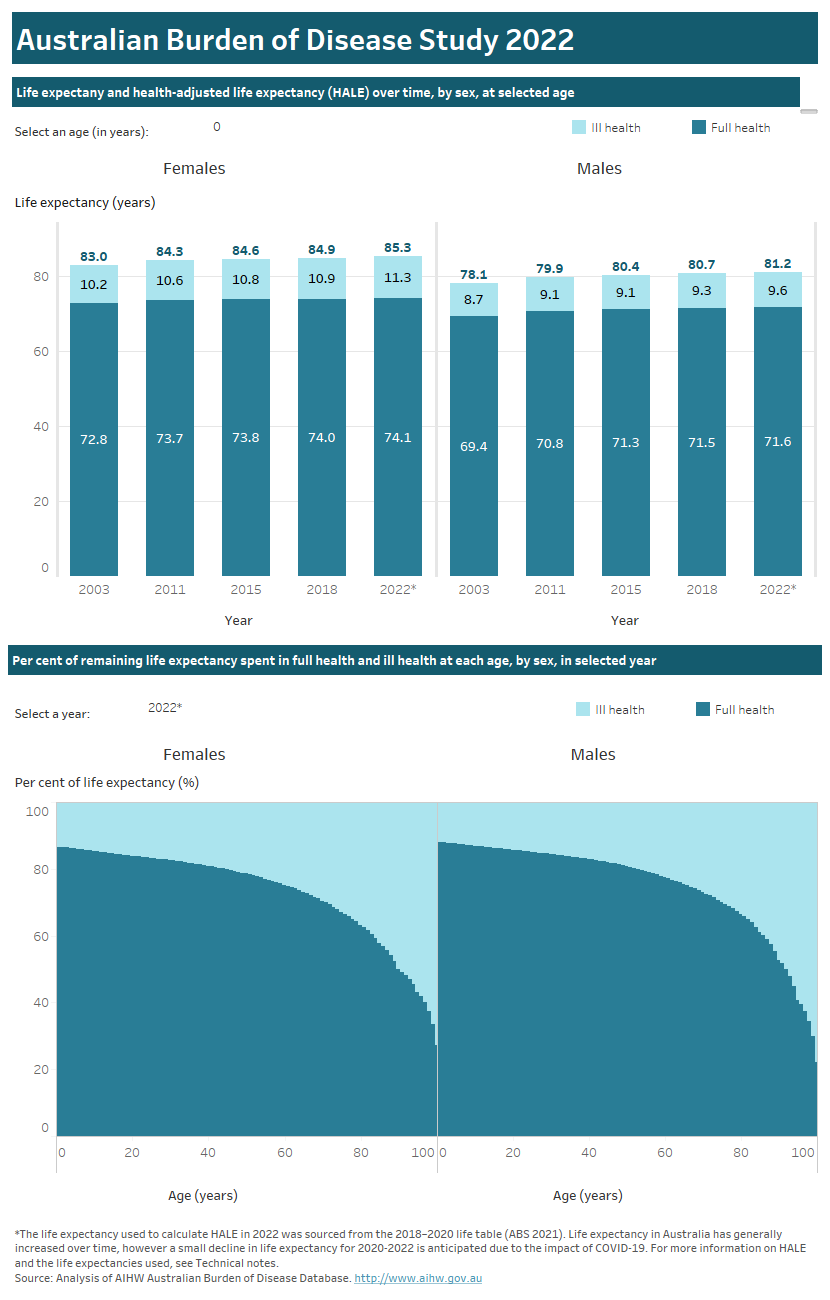
Health-adjusted life expectancy (HALE) extends the concept of life expectancy (the number of years a person can expect to live) by considering the number of years a person of a particular age could expect to live in full health (without disease and/or injury) and in ill health (with disease and/or injury). For example, a 21-year-old male can expect to live 52.0 years (86%) of their remaining life in full health and 8.7 years (14%) of their remaining life in ill health based on estimated age-specific morbidity and mortality rates in 2022. For detailed methods for the estimation of HALE, refer to the Australian Burden of Disease Study: methods and supplementary material 2018 report.
Life expectancy and HALE can be measured at any age but are typically reported from birth (which represents the average life expectancy in years for a baby born that year) and at age 65, describing health in an ageing population.
The ratio of HALE to life expectancy, expressed as a percentage, represents the proportion of life expectancy that is spent in full health. Comparing the ratio over time can highlight whether or not an increase in life expectancy is accompanied by an increase in time spent in full health or in ill health.
Use the interactive graphs below to explore the health-adjusted life expectancy of Australians, at various ages and by sex, for the most recent year (2022) compared with previous years (2003, 2011, 2015 and 2018). For a discussion of results related to HALE, refer to the Summary.
The life expectancy used to calculate HALE in 2022 was sourced from the 2018–2020 life table (ABS 2021). Life expectancy in Australia has generally increased over time, however, a small decline in life expectancy for 2020–2022 is anticipated due to the impact of COVID-19, compared to the 2018–2020 life table. For more information on HALE and the life expectancies used, see Technical notes.
Use the drop-down list above each graph to view the data by age (top graph) or by year (bottom graph).


Hover over the bars on the charts for additional information.
The toolbar at the bottom of the visualisation enables users to interact with the data in different ways:

Undo = Undo the latest filter applied.
Redo = Redo the latest filter applied.
Revert = Clears all filters applied and reverts visualisation to default filters.
Refresh = Connects to the underlying data source and updates the visualisation with any changes in the data (not applicable to this visualisation).
Pause = Stops the visualisation from updating each time a filter is changed, enabling multiple filters to be changed at once. Clicking ‘Resume’ will update the visualisation according to the selected filters.
Share = Generates a link that can be shared (note that filters will not be applied when link is shared).
Download = Allows a downloadable file as either an image (PNG), PDF or PowerPoint file. This is a useful way to save a snapshot of the visualisation to include in a document or presentation.
Full screen = Displays the dashboard in full screen mode (press Esc to return to original view).
This interactive data visualisation presents life expectancy and health-adjusted life expectancy by age and sex for the years 2003, 2011, 2015, 2018 and 2022. There are two sections. The first section presents two stacked column charts, one for males and one for females. Each chart has 5 columns representing each year of data. The vertical axis represents the total life expectancy in years. The columns are shaded to show the number of years a person can expect to life in full health and in ill health. The figures can be customised to report data according to the expected remaining years of life in full health and ill health at a particular age (ranging from 0 to 100 years). The second section is two stacked column charts, one for males and one for females. Each chart has a column for each age, in single years ranging from 0 to 100. Each column is shaded to show the proportion of remaining life expected to be lived in full health and the proportion expected to be lived in ill health. The figures can be customised to report data according to the year of data (2003, 2011, 2015, 2018 or 2022).

References
ABS (Australian Bureau of Statistics) (2021) Life tables, 2018–2020, ABS, accessed 1 July 2022.


