Technical notes
Data sources
COVID-19 deaths for 2022 were sourced from 2 key sources:
- Australian Bureau of Statistics (ABS) death registration data
This is the official Australian deaths data collected via the state/territory Registrars of Births, Deaths and Marriages. It includes death registration data and medical cause of death information completed by a certifying medical practitioner and is considered a high-quality data source. In early-mid 2020, the ABS started releasing provisional deaths data to monitor the impact of the COVID-19 pandemic. Further information about the completeness and timeliness of ABS provisional deaths data is available on the ABS website.
- National Notifiable Diseases Surveillance System (NNDSS) data
Data are collected by state and territory infectious disease surveillance systems and compiled into a national data source by the Australian Government Department of Health and Aged Care. Surveillance requires more timely data to enable a quicker public health response to outbreaks. Because it can be difficult to attribute a death to a single cause, particularly for people who have multiple and co-morbid conditions, the NNDSS reports deaths which include death in a probable or confirmed COVID-19 case, unless there is a clear alternative cause of death that cannot be related to COVID-19 (e.g. trauma).
Estimating fatal burden in 2022
Doctor-certified COVID-19 and COVID-19 related deaths between January and August 2022 were provided by the ABS. The COVID-19 associated deaths between January and August 2022 were extracted from published data on the NNDSS website.
As the ABS data were incomplete for August 2022, data from the NNDSS were used to inform the number of COVID-19 deaths for this month. The monthly changes of COVID-19 deaths were calculated from the NNDSS and applied to ABS data to derive the number of COVID-19 deaths for August. The COVID-19 deaths for the remainder of 2022 were modelled with an assumption of a gradual decline to December. The total number of deaths was inflated by 2.5% to account for coroner-certified COVID-19 deaths.
The estimated COVID-19 deaths for 2022 were disaggregated by age and sex, using the age and sex distributions from the provisional deaths provided by the ABS. The standard reference life table was then applied to the estimates to derive the YLL at each age.
Non-fatal burden
Conceptual model
The conceptual model for COVID-19 is shown in Figure 1, which was the consensus model being used by the European Burden of Disease Network (EBDN) to calculate non-fatal burden due to COVID-19 at the time of analysis. Important components of the YLD model which acquire health loss (Figure 1) include:
- Mild/moderate cases: correspond to those not requiring hospitalisation to treat their disease. It is noted that some cases in Australia were hospitalised to maintain strict isolation rather than because of the severity of their disease (particularly at the start of the pandemic).
- Severe cases: correspond to those hospitalised to treat their disease, but not requiring admission to intensive care units (ICU).
- Critical cases: correspond to people who were treated in ICU.
- Post-acute consequences: correspond to cases with post COVID-19 condition (also known as ‘long COVID’). Evidence is still emerging on this so a simple model was adopted for this Study. A more detailed model may be developed in the future as more data become available.
Permanent functional impairment from COVID-19 was not included in this Study due to a lack of evidence. More elapsed time is needed to understand these potential consequences.
Figure 1: Conceptual model for COVID-19 burden of disease analysis
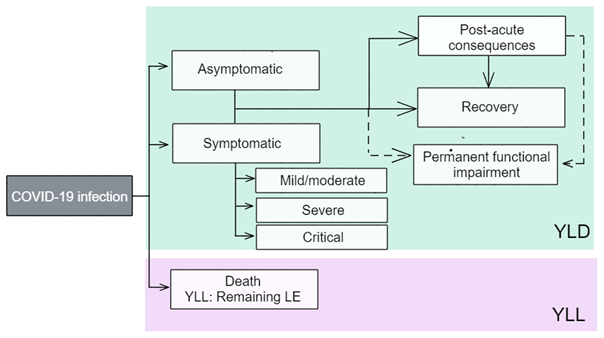
LE = life expectancy; YLD = years lived with disability; YLL = years of life lost.
Source: EBDN 2020.
Model parameters: disability weights and disease durations
The ‘disability weights’ reflect the severity of the disease and correspond to a ‘health state’ which describes the average experience for people at that severity level. As is the usual approach in the ABDS, the use of GBD disability weights was prioritised. However, an additional disability weight (for critical cases) sourced from the European Disability Weight survey (Haagsma et al. 2015) was used as no corresponding disability weight was available from the GBD at the time of analysis.
Table 1 outlines the disability weights for each health state. The disability weights were drawn from EBDN 2020.
It is important to note that in this Study:
- Asymptomatic cases have no disability weight as these cases are considered to have no health loss. The possible burden of isolation and worry of potential transmission to family members is not counted.
- The model may change in future studies as more evidence and data on COVID-19 and long COVID emerge. The AIHW continues to liaise with the COVID-19 Epidemiology and Surveillance Team at the Department of Health and Aged Care and the EBDN, as well as review other sources (for example, GBD) and assess international developments in the model for long COVID.
Table 1: Health states and corresponding disability weights for COVID-19 analysis
| Health state type | Severity level | Health state | Disability weight |
| Acute infectious disesase | Asymptomatic | Has infection but experiences no symptoms | Nil |
| Mild/moderate | Has a fever and aches, and feels weak, which causes some difficulty with daily activities | 0.051 | |
| Severe | Has a high fever and pain, and feels very weak, which causes great difficulty with daily activities | 0.133 | |
| Critical | Intensive care unit admission | 0.655 | |
| Chronic infectious disease | Post-acute consequences | Is always tired and easily upset, the person feels pain all over the body and is depressed. | 0.219 |
The duration used for mild/moderate cases was 7 days due to the shorter duration of Omicron infection, which was the dominant variant in Australia in 2022 (Menni et al. 2022). The duration parameters for severe and critical cases are based on empirical data on average length of stay from the National Hospital Morbidity Database (NHMD), using the period from 1 July 2020 to 30 June 2021, which were the latest available data from the NHMD at the time of analysis. It was assumed that the same durations would apply for those hospitalised due to COVID-19 in 2022. Hospitalisations without an ICU admission are used for severe cases, and those with ICU admission for critical cases. Median length of stay for critical cases only includes time spent in ICU—their time spent outside of the ICU is counted under the median length of stay for severe cases.
The average duration parameter used for post-acute consequences is 4 months, corresponding to a third of a year (GBD Long COVID Collaborators 2022). This is a broad assumption as data on the full trajectory for people with long COVID are still emerging.
Data sources
Broadly, the number of people in each severity category were required. Ideally, this would be from national data sets, but where there were data gaps, state/territory level data were used and adjustments made for national analysis.
The input data needed to reflect the full coverage of cases, with any under-ascertainment adjusted for with appropriate data, if available. Under-ascertainment for COVID-19 is becoming a bigger issue as time goes on due to the move from close contact tracing and strict requirements for PCR-based testing, to rapid antigen testing and reliance on self-reporting. Under-ascertainment is discussed further in each severity category.
Asymptomatic cases
An AIHW COVID-19 report (AIHW 2021b) used figures from a meta-analysis (Byambasuren et al. 2020) to estimate the proportion of asymptomatic COVID-19 cases. This showed that 17% of cases were truly asymptomatic (for example, excludes pre-symptomatic cases). However, this review was conducted in 2020 and due to the emergence of newer variants and sub-variants, higher vaccination rates and changes in requirements for COVID-19 testing in 2022, it is likely this proportion is no longer suitable.
As no data on asymptomatic cases were available, it was assumed that the NNDSS only includes symptomatic cases and the inclusion of asymptomatic cases is minimal in estimates of mild/moderate cases.
Mild/moderate cases
This was calculated as the total number of confirmed cases recorded in the NNDSS.
Under-ascertainment would be highest in the mild/moderate category. Given the lower severity (and hence lower contribution per case to the disease burden) in this category and challenges with adjusting for under-ascertainment with currently available data, there was not enough information to inform adjustments for under-ascertainment in this Study. There are serosurvey studies that measure the prevalence of antibodies to SARS-CoV-2 in the blood donor population (e.g. the National Centre for Immunisation Research and Surveillance, the Kirby Institute’s Australian COVID-19 Serosurveillance Network serosurveys). However, the blood donor population may not be representative of the general Australian population.
Severe and critical cases
The number of severe cases are the number of cases admitted to hospital minus those admitted to ICU. This was calculated by applying the proportion of cases that were admitted to hospital but not in ICU (sourced from the NNDSS) to the total number of COVID-19 cases. Age distributions were from published COVID-19 reports by NSW Health.
Critical cases are the number of cases admitted to ICU. This was calculated by applying the proportion of ICU admissions obtained from the NNDSS to the total number of COVID-19 cases. Similar to the estimates for severe cases, age distributions were from multiple published NSW COVID-19 reports (NSW Health 2022).
It is assumed that there would be virtually no under-ascertainment among the severe and critical categories as it is unlikely that people who require hospital care would not receive that care in Australia. People admitted would almost certainly have been tested for SARS-CoV-2 if there was any chance they had contracted it.
As there may be people who contracted COVID-19 in hospital (but did not suffer from severe or critical disease), identification of these cases in the data would be useful for burden estimation when more detailed hospitals data become available. However, it is acknowledged that because these cases cannot be identified, it may result in an overestimate of the burden due to severe COVID-19 (though an underestimate of mild/moderate cases).
It was assumed that in 2022, the number of cases who were admitted to hospital for isolation purposes rather than treatment was minimal.
Post-acute consequences
Australian data on this cohort are becoming more available (Darley et al. 2021; Liu et al. 2021). However, there was still no standard definition and set of symptoms for long COVID at the time of analysis and reporting. For the ABDS 2022, a proportion of 4.5% (for those aged 25 years and older) and a proportion of 1.44% (for those aged under 25 years) were used to estimate the number of cases who developed post-acute consequences from their COVID-19 infection. The proportion for those aged 25 years and over was sourced from the study by Antonelli et al. (2022) and was the proportion of Omicron cases who experienced long COVID. This proportion was not used for those aged under 25 years as there is evidence showing the likelihood of getting long COVID in younger age groups is lower (GBD Long COVID Collaborators 2022). The proportion for those aged under 25 years was based on the estimated percentage of people under 25 years living in private households with self-reported long COVID of any duration in the UK. This proportion was based on the UK Coronavirus (COVID-19 Infection Survey) data for the 4-week period ending 3 September 2022 (ONS 2022).
Estimating non-fatal burden in late 2022
NNDSS data were available for 1 January to 31 August 2022. Hospital proportions were derived from data for the same period. Similar to estimating fatal burden from COVID-19, non-fatal burden was estimated using monthly trends in case numbers. It was assumed that there was an exponential decline in the number of cases from September to December 2022. As described above, proportions from the NNDSS and from Antonelli et al. (2022) were applied to the total number of COVID-19 cases for 2022 to estimate the point prevalence of acute infection of COVID-19 by severity and post-acute consequences of COVID-19. However, this assumes that any trend in the number of cases at the time of analysis will continue for the remainder of the year. If there are any marked changes in COVID-19 cases and deaths in Australia later in the year, estimates for 2022 will be revised in the next study.
Estimation of lower respiratory infections (including influenza and pneumonia) for 2022
Fatal burden
Deaths due to lower respiratory infections (LRIs), including influenza and pneumonia, were sourced from the ABS death registration data and the Australian Influenza Surveillance Reports. The Australian Influenza Surveillance Reports are compiled from a number of data sources, including laboratory-confirmed notifications to the NNDSS; influenza-associated hospitalisations; sentinel influenza-like illness (ILI) reporting from general practitioners; ILI-related community level surveys; and sentinel laboratory testing results. See Department of Health and Aged Care for more information.
Deaths for 2022 were first estimated for fatal burden calculations and were derived separately for LRIs and influenza. Provisional doctor-certified deaths by month and age groups from January to June 2022 were provided by the ABS and used as death estimates for the first 6 months of 2022. Doctor-certified deaths were estimated for July to December 2022 using various methods. For LRIs, monthly deaths from the Australian Influenza Surveillance Reports were compared with the ABS provisional deaths data supplied. The proportional differences were used to adjust the deaths in July and August reported in the Australian Influenza Surveillance Reports.
For the remainder of 2022, the pattern of monthly doctor-certified deaths in 2019 were used to inform the proportional increase (or decrease) of deaths from one month to the next month.
Using deaths between 2011 and 2019 from the National Mortality Database, we derived the average inflation factor from all deaths to doctor-certified deaths for LRIs and influenza. This factor was applied to the number of doctor-certified deaths estimated for 2022.
The age distribution from the provisional deaths provided by the ABS were applied to the total number of deaths estimated for 2022. The standard reference life table was then applied to the estimates to derive the YLL at each age.
Non-fatal burden
Conceptual models
Lower respiratory infections (LRIs, including pneumonia)
The following disease model forms the conceptual basis for modelling YLD calculations for LRIs, including the sequelae, health states and disability weights.
Figure 2: Conceptual model for lower respiratory infections
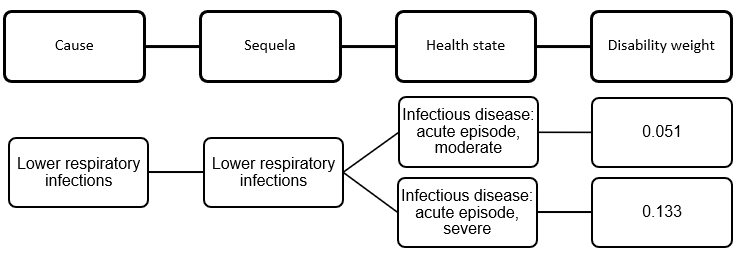
A duration of 2 weeks was used for both health states to estimate point prevalence.
Influenza
The following disease model forms the conceptual basis for modelling YLD calculations for influenza, including the sequelae, health states and disability weights.
Figure 3: Conceptual model for influenza
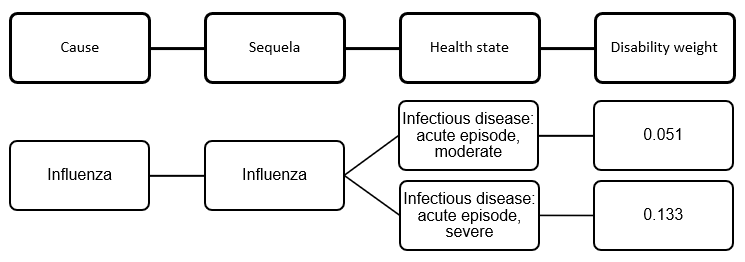
A duration of 2 weeks was used for both health states to estimate point prevalence.
Data sources from ABDS 2018
For the ABDS 2018, the following data sets were used for estimating burden from LRIs (including pneumonia) and influenza:
- The Bettering the Evaluation and Care of Health (BEACH) program data were used to estimate the total incidence of LRIs (including pneumonia) and influenza, accounting for the moderate severity in each of the above conceptual models. As the BEACH program last published data for 2016, disease rates for that year were applied to the 2018 population. Influenza is notifiable in all states and territories. However, notifications are ‘strongly influenced by the healthcare seeking behaviour of patients, testing, notification practices and follow-up by jurisdictional health departments’ (Li-Kim-Moy et al. 2016). Notifications are likely to be a significant underestimate of influenza incidence.
- The incidence of severe cases of LRIs and influenza were sourced from the National Hospital Morbidity Database (NHMD). The latest data available for the NHMD are for 1 July 2020 to 30 June 2021.
Influenza
For the ABDS 2022, national notifications information published by the Australian Department of Health and Aged Care (DHAC 2022) were used to explore trends in influenza between 2017 and 2022. Based on this, it was assumed that the overall number of influenza cases in 2022 will be similar to 2017 and 2019. There are some limitations with this assumption. Firstly, the degree of under-ascertainment in influenza notifications data in 2017 and 2019 is unknown. The degree of under-ascertainment may also change from year to year depending on factors such as testing rates and severity of disease for that year.
With this assumption, severe influenza point prevalence estimates for 2022 were modelled using patterns from 2017 and 2019 hospitalisations—2018 hospitalisations were excluded since hospitalisations in that year were considerably lower than 2017 and 2019. Moderate influenza point prevalence for 2022 was then modelled using the ratio of moderate point prevalence to severe point prevalence in 2019.
Lower respiratory infections (including pneumonia)
There were no national data on incidence of LRIs for 2022 at the time of analysis. However, it was observed that hospitalisations for LRIs were stable between 2017 and 2019. It was assumed that hospitalisations for 2022 would be similar to the hospitalisation trends between 2017 and 2019 following the reduction in public health measures from COVID-19, which had resulted in lower hospitalisations due to LRI in 2020 and 2021.
With this assumption, severe LRI point prevalence estimates for 2022 were modelled using patterns in hospitalisations from 2017, 2018 and 2019. Moderate LRI point prevalence for 2022 was then modelled using the ratio of moderate point prevalence to severe point prevalence in 2019.
Estimating non-fatal burden in late 2022
As the ABDS 2022 is estimating disease burden in the same year as publication, there are a number of months of the year where burden estimates needed to be modelled. As outlined above, it was assumed that the overall estimate for the calendar year 2022 would be similar to 2017–2019 for LRIs and to 2017 and 2019 for influenza.
Population data
Population data were used to derive rates in this report. The Australian population data between 2015 and 2019 were sourced from rebased ABS Estimated Resident Population (ERP) (released on 27 June 2017) (ABS 2017). Population data between 2003 and 2011 were sourced from final population estimates from the 2011 Census (released 15 December 2016) (ABS 2016a).
Population data for 2022 were sourced from population projections by the Centre for Population (2021). At the time of analysis, these data were the only available source which factored in the early impacts of the COVID–19 pandemic on Australia’s population. The components of the population projection included population growth, net overseas migration and natural increase, with assumptions made regarding migration, mortality, and fertility rates (Centre for Population 2021). The population ‘Central scenario’ was used for this Study. This scenario assumed that the COVID-19 pandemic has significantly impacted the net migration in Australia in 2020–2021.
YLD data quality
The burden estimates for ABDS 2022 were largely based on trend analyses. The quality of input estimates in the ABDS 2022 for earlier reference years (2003, 2011, 2015 and 2018) are the same as the quality presented in the ABDS 2018. The ABDS 2018 estimates were produced using the best data available within the scope and time frame of the study. To provide information on the quality of estimates, a quality index was developed to rate estimates according to the relevance and quality of source data, and methods used to transform data into a form required for analysis. Generally, the higher the rating, the more relevant and accurate the estimate.
Fatal burden (YLL) estimates were considered to have the highest rating for both data and methods used, whilst non-fatal burden (YLD) estimates varied depending on the disease or injury, and the data sources used.
Information about the quality of the YLD 2018 estimates and the data and methods used can be found in Appendix B in the Australian Burden of Disease Study: impact and causes of illness and death in Australia 2018 report and in the Australian Burden of Disease Study: methods and supplementary material 2018 report.
For the first time, COVID-19 was added to the ABDS 2022 as a new disease. Lower respiratory infections (including influenza and pneumonia) were adjusted using recent data due to available evidence that these diseases were impacted by COVID-19. To help users understand the potential sources of uncertainty associated with the estimates, the 2-dimensional index developed for the burden estimates was used for these 2 diseases. This index was derived based on:
- the relevance of the underlying epidemiological data
- the methods used to transform that data into a form required by this analysis.
The quality of COVID-19 and lower respiratory infections (including influenza and pneumonia) are discussed below.
COVID-19
Estimates for COVID-19 are considered to be of somewhat reasonable quality. Data sources were considered relevant as they were broadly derived from the NNDSS. However, the estimates for post-acute consequences of COVID-19, which is the biggest contributor to non-fatal burden, were calculated using 2 proportions (one proportion for those aged under 25 years and another for those aged 25 years and over) so substantial modelling was done to estimate burden by sex and 5-year age groups. Estimates also needed to be modelled for the last 4 months of the year, which relied on the assumption that the current decreasing trend in number of cases will continue for the remainder of the year. Therefore, estimates must be used with caution.
Data score = D
Method score = D
Lower respiratory infections (including influenza and pneumonia)
Estimates for LRIs are considered to be of reasonable quality. Modelling was based on assumptions that LRIs and influenza were similar to years before the COVID-19 pandemic. These assumptions may not hold once 2022 data are available. Therefore, estimates must be used with caution.
Data score = C
Method score = C