Example 2: Health outcomes after diagnosis
On this page:
The COVID‑19 Register links case notifications identified in state and territory systems to a range of health datasets. The advantage of linked data is that these cases can be ‘followed’ over a longer period of time for a range of outcomes, for instance years, than the usual case surveillance period which may only be a few weeks. Linked data can tell us if a person has had a hospital admission, been provided a prescription for medication, or subsequently died. In this section, we look at individuals with both a COVID‑19 diagnosis and a record on the National Death Index (NDI) to demonstrate how the linked data could be used to monitor deaths following a COVID‑19 diagnosis. Existing surveillance systems are able to monitor how many people were dying from the acute effects of COVID‑19, however, there has been limited information on long-term mortality patterns caused by the COVID‑19. The COVID‑19 Register can provide information on the extent to which deaths were associated with a prior COVID‑19 diagnosis and this differs from existing publications on COVID‑19 deaths and excess mortality which only use official death records.
Deaths
In the analysis cohort the median age of those who died was 75 years (interquartile range 62-85). In comparison, the median age at death for people in Australia was 82 years (ABS 2023). Around 842 people (1%) in the analysis cohort had a death recorded on the National Death Index by 30 June 2022.
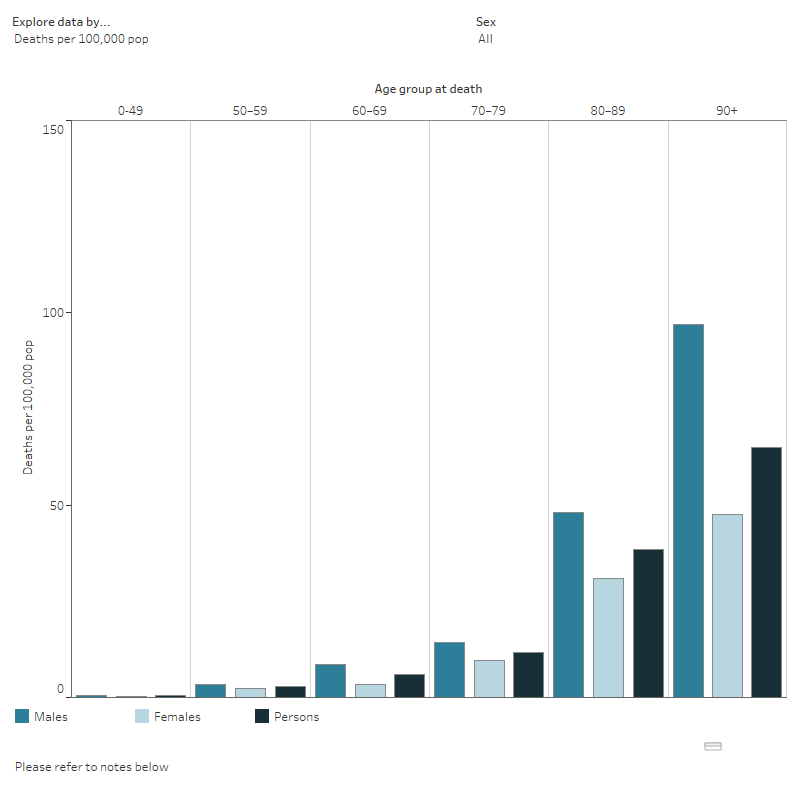
The COVID‑19 Register can also be used to explore the time from diagnosis to death. In the example cohort, of the 842 deaths, 498 (59%) died within 1 month, 642 (76%) died within 3 months and 720 (86%) had died within 6 months. It is important to note that these individuals could have died of other causes unrelated to their COVID‑19 diagnosis. The median time from diagnosis to death was 22 days (interquartile range 11–61). Of those who died within 30 days, around a third (32.8%) of deaths occurred in those aged 80–89 (Figure 5).
The number of people who died within 30 days in each age group varied by sex. There were more deaths per 100,000 population in males than females in all age groups, with the largest difference observed in the 90+ age group, where the proportion was almost twice that in males than females (97 per 100,000 males compared with 48 per 100,000 females).
Future analysis could explore how these trends compared to deaths of other diseases and explore these results in subsequent versions of the data.
The interactive data visualisation (Figure 5) can be customised by selecting from the 2 drop-down menus to explore deaths data by measure and sex. Access the Data table using the tab.
Figure 5: Deaths (any cause) within 30 days of diagnosis by age at death and sex in the analysis cohort
Chart shows the COVID‑19 proportions by age at death and sex among the linked analysis cohort, where the proportions are generally higher among older groups especially if they are males.

Notes:
- Age group at deaths is derived using age as at 31 December 2021 from the MCD and age at death from the NDI.
- For more details on how death proportions (deaths per 100,000 population) were computed and how sex was derived, refer to Technical notes.
- Excludes records with missing age group at death due to missing date of birth from the MCD.
Source: AIHW analysis of COVID‑19 Register (version 1)
Reference
ABS (2023) Deaths, Australia, ABS website, accessed 15 June 2023.


