Technical notes
Factors to consider when reading this report
The analysis examples presented in this report are based on version 1 of the COVID‑19 Register. This data set comprises COVID‑19 notifications from New South Wales, South Australia, Tasmania, Northern Territory and the Australian Capital Territory.
Therefore, the findings presented in the report are based on a subset of the total COVID‑19 cases in Australia as not all state and territory data are included in version 1, and the COVID‑19 data time periods vary by jurisdiction. In addition, some COVID‑19 cases will not have been identified (not tested) or reported to the notifiable diseases’ registers in jurisdictions (for example, positive rapid antigen tests not reported to public health units).
Results are likely to change in future reports when the COVID‑19 Register is updated to include other jurisdictions and improved consistency in time periods across jurisdictions.
About the COVID‑19 Register
In April 2022, the AIHW was funded by the Medical Research Future Fund to establish a national linked data platform using existing health data sets to strengthen evidence-based public health and health system planning and management for current and future pandemics. The platform links jurisdictions’ COVID‑19 notification data to a range of administrative datasets, including hospitalisations, Medicare Benefits Schedule (MBS), Pharmaceutical Benefits Scheme (PBS), aged care, deaths and immunisations. It aims to provide person-level information on people’s health outcomes and health service usage before and after a COVID‑19 diagnosis.
In December 2022, the data were made available to government researchers, and a summary report detailing the initial linkage results, methods, aims and benefits of the project was published. This report can be found at COVID‑19 linked data set: Linkage results.
Study timeline and coverage
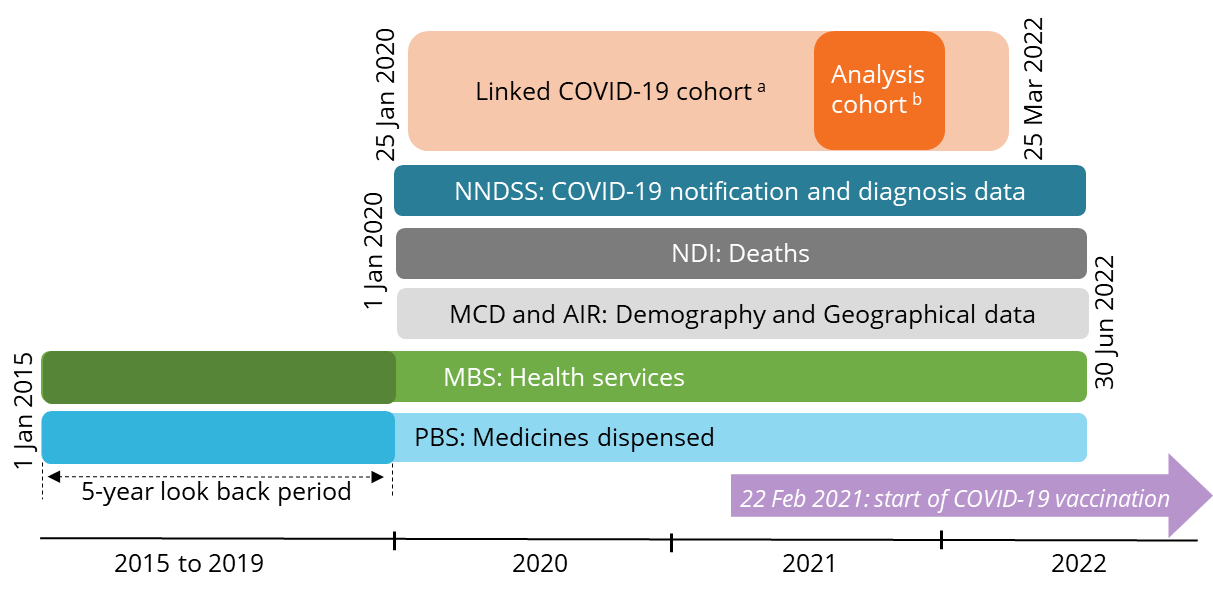
This analysis was based on COVID‑19 cases from participating states and territories linked to a range of administrative data sources, including the National Notifiable Diseases Surveillance System (NNDSS), the National Death Index (NDI), the Medicare Consumer Directory (MCD), the Australian Immunisation Register (AIR), MBS and PBS. The overall analysis period was between 1 January 2020 and 30 June 2022. However, the time periods vary by jurisdiction for the COVID‑19 data included in version 1 (see Table A1).
| Participating state/territory | First COVID‑19 notification date included | Last COVID‑19 notification date included |
|---|---|---|
| NSW | 25 January 2020 | 24 November 2021 |
| SA | 30 January 2020 | 11 February 2022 |
| Tas | 2 March 2020 | 30 November 2021 |
| ACT | 12 March 2020 | 23 March 2022 |
| NT | 21 February 2020 | 25 March 2022 |
Time periods available for administrative data also vary for some collections, depending on the range of data that becomes available at the time of analysis. For this version of the data, administrative data are up to 30 June 2022 (Figure A1).
Figure A1 shows in more detail the time period and data used from each administrative data source linked to the COVID‑19 cohort. The NNDSS (for COVID‑19 notification and diagnosis data), the NDI (for deaths data), and the MCD and the AIR (for demography and geographical data) were available from January 2020 to June 2022. Health service and prescriptions data were sourced from MBS and PBS respectively and were available for a longer period from January 2015 to June 2022 for the purpose of a 'look-back' period where needed. It is noted in Figure A1 that the Australia-wide COVID‑19 vaccination program was rolled out on 22 February 2021.
Figure A1: Data sets used in the analysis of the COVID‑19 case study population (based on the COVID‑19 Register version 1)

Notes:
- Linked COVID‑19 cohort consist of COVID‑19 notification data from participating states and territories. For COVID‑19 Register version 1, the list of participating states and territories include NSW, SA, Tasmania, ACT and NT.
- The analysis cohort refers to people whose first COVID‑19 notification had a diagnosis date between 16 June and 14 December 2021, when the Delta variant was dominant.
Creation of the cohort
The COVID‑19 cohort used in this analysis was created from unique, linked COVID‑19 cases from the COVID‑19 notification data received from participating state/ territories. Overall, 259,816 people were identified from the COVID‑19 notification data received from participating states/ territories from January 2020 to March 2022 (refer to Introduction – Figure 1).
Confirmation status
The variable ‘confirmation status’ from the NNDSS was used to exclude cases from the cohort which did not fall into our definition of eligible cases. This was based on the Communicable Diseases Network Australia (CDNA) Series of National Guidelines (SoNGs) definitions, and adapted for linked individuals with multiple diagnosis with conflicting ‘confirmation status’. It followed:
- For COVID‑19 cases pre-Omicron, that is, pre-15 December 2021, only ‘confirmed’ COVID‑19 cases were included.
- For cases during and after the Omicron wave (15 December 2021 onwards), those identified as ‘probable’ or ‘confirmed’ were included in the cohort as Rapid Antigen Test (RAT) were approved during this period.
- Cases with a ‘historic’ designation were removed from the cohort if that were the only diagnosis received for that individual.
- If a case has multiple notifications with different ‘confirmation status’ (that is, confirmed, probable or historic), they were retained if one notification is ‘confirmed’ regardless of what the other prior or subsequent notifications were (Department of Health 2022a).
The time periods for COVID‑19 variants were defined as per reporting of variants in the Communicable Diseases Intelligence COVID‑19 Epidemiology reports.
Creating an analysis cohort
The COVID‑19 Register version 1 cohort was divided into 2 groups:
- Full cohort (or linked confirmed COVID‑19 cohort in Introduction – Figure 1) – all unique records identified as a notified COVID‑19 case according to the COVID‑19 notifications data from participating states and territories, excluding unlinked, duplicates and ‘unconfirmed’ cases.
- Analysis cohort – all unique records identified as a confirmed COVID‑19 case with a first diagnosis date between 16 June 2021 and 14 December 2021 according to the COVID‑19 notifications data from participating states/territories.
Service use cohort
For analysis on patterns of health service use and prescriptions dispensed, people who had multiple COVID‑19 diagnosis (that is, potential reinfections) were excluded as their health service use was expected to be higher than those with only one diagnosis. People who died within 6 months of their diagnosis were also excluded as this analysis aimed to look at health service use and prescriptions dispensed within 1, 3, or 6 months of a COVID‑19 diagnosis. This is detailed in Introduction – Figure 1.
Exclusion of COVID‑19-related deaths
There were instances where an individual may have died with/from a COVID‑19-related cause of death (identified via linkage with the NDI) but were not identified through the state and territory notifications data. These records were not included in the cohort. This is because individuals with only a COVID‑19 death record in the NDI would not have a corresponding diagnosis date and as such it would not be possible to track patients journey before and after a COVID‑19 diagnosis. This is detailed in Introduction – Figure 1.
Demographics
Age groups
The age of people in the full cohort was based on a person’s age as at 31 December 2021 and age at death. To calculate a person’s age at 31 December 2021, their date of birth was derived from the month and year of birth record in the MCD and a day of birth of 15 was assigned to all records to ensure consistency. For records with missing date of birth, the age at onset from the NNDSS was used. This is a person’s age at the time of onset of COVID‑19. Less than 1% of the cohort were missing age after deriving from the MCD and NNDSS. Age at death was derived by using date of death from the NDI and date of birth from the MCD.
For reporting purposes, age demographics were reported in 5-year age groups, where numbers permitted. Where there were small counts in each age group, age groups were aggregated to greater than 5-year intervals. Health service usage analysis was reported by 10-year age groups.
Sex
A hierarchical approach was used to derive a person’s sex. Firstly, the MCD data set was used as the primary data for determining sex. Thereafter, where missing, sex was inputted from the AIR and finally the NNDSS. Overall, less than 1% of records in the COVID‑19 cohort were missing sex after inputting from MCD, AIR and NNDSS.
Data provided on sex contained other categories (such as ‘not stated’ and ‘undetermined’). However, due to small cell counts, the data were not reported to maintain privacy and confidentiality of these individuals.
State of usual residence
State of usual residence was derived from Statistical Area level 2 (SA2) from the MCD. SA2 is a small area unit within the ABS’ 2016 Australian Statistical Geography Standard (ASGS). The first digit of the corresponding SA2 for each record was mapped to its relevant state/territory according to Table A2.
| First digit of SA2 | Corresponding state/territory |
|---|---|
| 1 | New South Wales |
| 2 | Victoria |
| 3 | Queensland |
| 4 | South Australia |
| 5 | Western Australia |
| 6 | Tasmania |
| 7 | Northern Territory |
| 8 | Australian Capital Territory |
| 9 | Other Territories |
Remoteness area and socioeconomic groups
Remoteness area was classified using the Australian Statistical Geography Standard (ASGS) Remoteness Structure 2016 which defines remoteness areas as:
- Major cities
- Inner Regional
- Outer Regional
- Remote
- Very Remote.
Remoteness areas are centred on the Accessibility/ Remoteness Index of Australia, which is based on distances people have to travel for services (ABS 2021). For this report, SA2s taken from the MCD were assigned to one remoteness category based on the largest percentage of population distribution as of June 2016. More information on the remoteness structure can be found on the ABS website.
Socioeconomic groups were classified using the ABS Index of Relative Socioeconomic Disadvantage (IRDS) 2016. The IRDS is a geographic based measure based on social and economic characteristics of a given area (ABS 2018). For this report, SA2s taken from the MCD were assigned their IRDS using a correspondence table. For the analysis in this report, the population was divided into 5 socioeconomic areas (containing around 20% of the population in each), based on the level of disadvantage of the statistical local area of their residence. The population living in the 20% of areas with the greatest overall level of disadvantage was described as the ‘lowest socioeconomic group’. The 20% at the other end of the scale – the top fifth – was described as the ‘highest socioeconomic group. More information can be found on the ABS website.
Deaths
Deaths data were drawn from the National Death Index (NDI). To identify the number of people who died after a COVID‑19 diagnosis, the cohort was linked with the NDI. The time from diagnosis to death was derived by calculating the difference between the date of death in the NDI and the diagnosis date from the NNDSS. It is important to note that the number of COVID‑19 deaths reported in the COVID‑19 Register may differ from those reported by state and territory health departments due to the nature of probabilistic linkage and differing definitions used.
Proportions
People diagnosed per 100,000 population
COVID‑19 proportions were calculated as the number of people diagnosed with COVID‑19 and residing in NSW, SA, Tas, NT and ACT divided by the ABS estimated residential populations (ERP) as at 31 December 2021 for these jurisdictions.
Similarly, age and sex-specific proportions were calculated for each ASGS remoteness area and quintile of the index of relative socioeconomic disadvantage (IRSD) using the ABS ERP as at 30 June 2021 for these jurisdictions.
Age-standardised proportions were calculated using the 2001 Australian Standard Population.
Deaths per 100,000 population
Age and sex-specific death proportions were calculated for individuals whose usual residence were in either NSW, SA, Tas, NT or ACT as the number of deaths that occurred within 30 days of diagnosis divided by the ABS ERP as at 31 December 2021 for these jurisdictions.
Medicare Benefits Schedule data for health service use
About the Medicare Benefits Schedule
The Australian Government provides a subsidy for services listed in the Medicare Benefits Schedule (MBS), for all Australian residents and certain categories of visitors to Australia. The major elements of the MBS are contained in the Health Insurance Act 1973. See details of the services covered by the MBS.
MBS benefits are claimable only for ‘clinically relevant’ services rendered by an appropriate health practitioner. A ‘clinically relevant’ service is one which is generally accepted by the relevant profession as necessary for the appropriate treatment of the patient.
In general, MBS statistics exclude services:
- to public inpatients and public outpatients of public and private hospitals
- to patients in public Accident and Emergency Departments
- covered by the Department of Veterans’ Affairs National Treatment Account
- covered by an entitlement conferred by legislation other than the Health Insurance Act (for example, services covered by third party or workers’ compensation)
- covered by other publicly funded programs.
On 13 March 2020, telehealth (via video conferencing and telephone) items were introduced into the MBS. From 1 July 2022, ongoing MBS telehealth arrangements have remained in place and provide for a wide range of telephone and video services by qualified health practitioners and support safe and equitable telehealth services. Details of the changes to the MBS due to the COVID‑19 pandemic are available on MBS online.
Broad type of service analysis
The health service usage analysis in this report was based on the date of service (that is, the date on which the visit to a health practitioner occurred, or when a procedure was performed, or when a test was undertaken). MBS-subsidised services were reported using the broad type of service (BTOS) classification, whereby each MBS item was allocated to a BTOS category. The BTOS groups and codes used in this report were:
- Non referred attendances – General Practitioner/ Vocationally Registered General Practitioner (VRGP) (101)
- Non referred attendances – enhanced primary care (102)
- Non referred attendances – other (103)
- Non referred attendances – practice nurse items (110)
- Specialist attendances (200)
- Obstetrics (300)
- Anaesthetics (400)
- Pathology collection items – Pathology Patient Episode Initiation (PEI) (501)
- Pathology tests (502)
- Diagnostic imaging (600)
- Operations (700)
- Assistance at operations (800)
- Optometry (900)
- Radiotherapy and therapeutic nuclear medicine (1000)
- Other allied health (150)
- Other MBS services (1100).
Services related to COVID‑19 vaccine support and receiving a COVID‑19 vaccine were excluded from the analysis (MBS item numbers 93644, 93653, 93660, 10660, 90005, 93645, 93654, 93661, 93646, 93655, and 10661). The categories and BTOS codes used to examine health service use by age group and sex are shown in Table A3.
| Broad type of service category | BTOS code(s) |
|---|---|
| Non referred GP attendances | 101, 102, 103 |
| Specialist attendances | 200 |
| Pathology collection items – Pathology Patient Episode Initiation (PEI) | 501 |
| Pathology testsa | 502 |
| Diagnostic imaging | 600 |
| Otherb | 110, 150, 300, 900, 1000, 1100, 400, 700, 800 |
Notes:
- Excluding COVID PCR tests (item numbers 69479, 69480, 69501)
- Includes Non-referred attendances – practice nurse items, Obstetrics, Anaesthetics, Operations, Assistance at operations, Optometry, Radiotherapy and therapeutic nuclear medicine, Other allied health, Other MBS
The percentage of the cohort with at least 1 service for each BTOS was calculated at 1, 3 and 6 months before and after a COVID‑19 diagnosis.
Things to consider when interpreting results
While MBS data provide useful information on medical services used, they provide limited information about why a service was used – and therefore it is not possible to determine, solely from MBS data, the reason a patient was visiting a GP.
Pharmaceutical Benefits Scheme data for prescriptions dispensed
About the Pharmaceutical Benefits Scheme
The Australian Government subsidises the cost of a wide range of prescription medicines through 2 separate schemes, the PBS and the Repatriation Pharmaceutical Benefits Scheme (RPBS). Claims for reimbursement for the supply of PBS- or RPBS-subsidised medicines are submitted by pharmacies through Services Australia for processing, and are provided to the Australian Government Department of Health and Aged Care. Subsidies for prescription medicines are available to all Australian residents who hold a current Medicare card, and overseas visitors from countries with which Australia has a Reciprocal Health Care Agreement. In general, patients pay a contribution to the cost of the medicine (co-payment), and the Australian Government subsidises the remaining cost. This subsidy is referred to as the benefit paid.
PBS data in this report were drawn from records of prescriptions dispensed under the 2 schemes, where either:
- The Australian Government paid a subsidy.
- The prescription was dispensed at a price less than the relevant patient co-payment (under co-payment prescriptions) and did not attract a subsidy.
PBS data cover all PBS prescriptions dispensed by approved suppliers, including community pharmacies, public and private hospital pharmacies and dispensing doctors.
PBS does not cover:
- over-the-counter purchases
- private prescriptions
- medicines supplied to admitted patients in public hospitals (prescriptions to patients on discharge and non-admitted patients in all states and territories are in scope, except for New South Wales and the Australian Capital Territory).
Medicines dispensed through alternative arrangements where the patient cannot be identified, such as direct supply to Aboriginal health services, are excluded.
Provision of some medicines may be under-represented in remote areas, particularly in the Northern Territory, where there are a high proportions of First Nations people who access medicines through Aboriginal health services.
Pharmaceutical Benefits Scheme scripts before and after a COVID‑19 diagnosis
Medication dispensed before and after a COVID‑19 diagnosis was investigated using the claims data from the PBS. Prescriptions dispensed in this report are based on the date the medicine was supplied to the patient. PBS data are an indication of medications dispensed and do not reflect usage or prescriptions provided to a patient.
The ATC code ‘R03 Drugs for Obstructive Airway Diseases’ was used to identify prescriptions relating to respiratory conditions. The pharmaceutical sales data component of the analysis in this report was focused on inhalers for shortness of breath (for the purposes of this analysis, inhalers with active ingredients salbutamol and terbutaline). These medications are inhaled into the lungs to relieve symptoms of asthma and other breathing problems. Inhalers for shortness of breath are often marketed as Ventolin or Asmol (salbutamol) or Bricanyl (terbutaline).
This report calculated the percentage of the cohort with at least one script at 1, 3 and 6 months before and after COVID‑19 for all scripts on the PBS, and then the percentage of the cohort with at least one respiratory medicine at the same time periods of interest.
Suppression of results
In line with AIHW attribute disclosure policy as well as data management protocols for this dataset, where cell counts were less than 5 (less than 6 for MBS/PBS data), both the count and the associated statistics were not reported. Rates, proportions and averages which used denominators of less than 100 were also supressed.
Linkage rates and quality
The first version of the COVID‑19 Register was made available to approved researchers in December 2022. This is the version used for the analysis in this report. The COVID‑19 Register has since been updated to version 2 and will continue to be updated as new versions of the register become available. The COVID‑19 Register uses probabilistic linkage.
Further information
For further information on linkage methods and high-level linkage rates for the COVID‑19 Register, refer to the report COVID‑19 linked data set: Linkage results.
Further information on linkage quality is available for researchers to use in the data to conduct sensitivity analysis for their results.
Abbreviations
| Abbreviation | Term or name in full |
|---|---|
| AIR | Australian Immunisation Register |
| BTOS | Broad Type of Service |
| GP | General Practice/General Practitioner |
| IRSD | Index of Relative Socio-economic Disadvantage |
| MBS | Medicare Benefits Schedule |
| MCD | Medicare Consumer Directory |
| NDI | National Death Index |
| NNDSS | National Notifiable Diseases Surveillance System |
| PBS | Pharmaceutical Benefits Scheme |
| RAT | Rapid Antigen Test |
| RPBS | Repatriation Pharmaceutical Benefits Scheme |
| SA2 | Statistical Area Level 2 |
Glossary
For a list of terms used in this report and their definitions, refer to glossary from the Australian Centre for Monitoring Population Health.
References
ABS (2018) Census of population and housing: Socio-Economic Indexes for Areas (SEIFA), Australia, 2016, ABS, Australian Government, accessed 14 April 2023.
ABS (2021) Remoteness Structure, ABS website, accessed 14 April 2023.
Department of Health (2022a) Coronavirus Disease 2019 (COVID-19) CDNA National Guidelines for Public Health Units, Department of Health, Australian Government, accessed 14 April 2023.