Broad flows
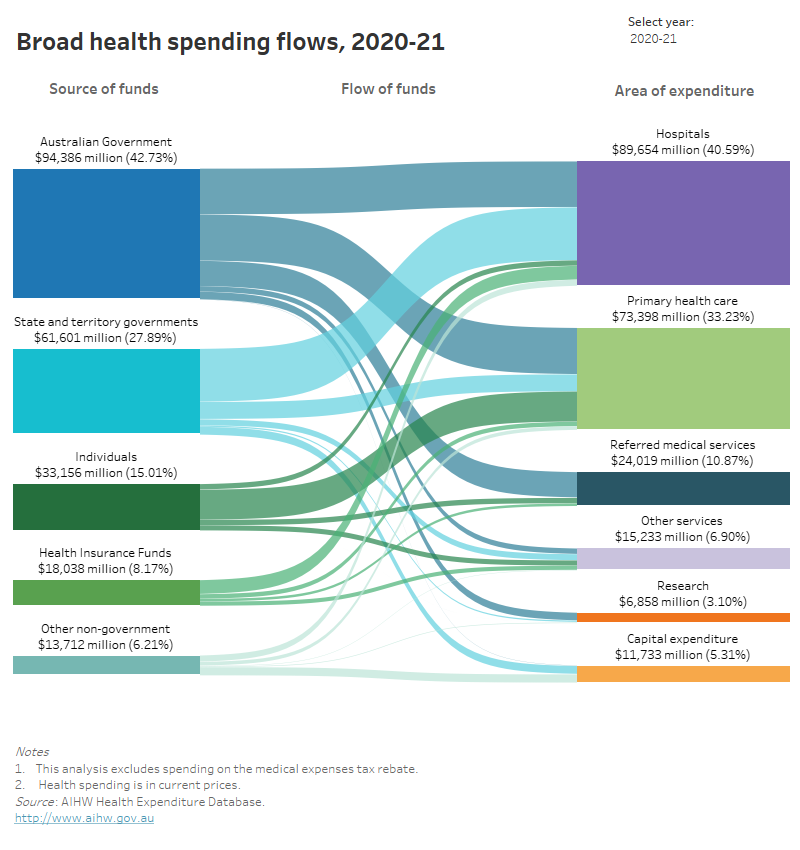
Broad health spending flows, 2020–21
Visualisation shows diagrams on health spending flows in current prices from sources of funds such as Australian Government, state and territory governments, Individuals, Health insurance funds and Other non-government into areas of expenditure: Hospitals, Primary health care, Referred medical services, Other services, Research and Capital expenditure. The diagrams cover the period from 1996–97 to 2020–21.


