Government spending on health relative to government expenses and taxation revenue
The ratios of government health spending to total government expenses and government health spending to tax revenue provide a broad indication of the amount of government financial resources being dedicated to health over time, how this compares with other sectors and how the mix of revenue sources being used to fund health is changing. In this context, comparisons to total government spending represents total government resourcing in terms of both tax revenue and other sources, including borrowing.
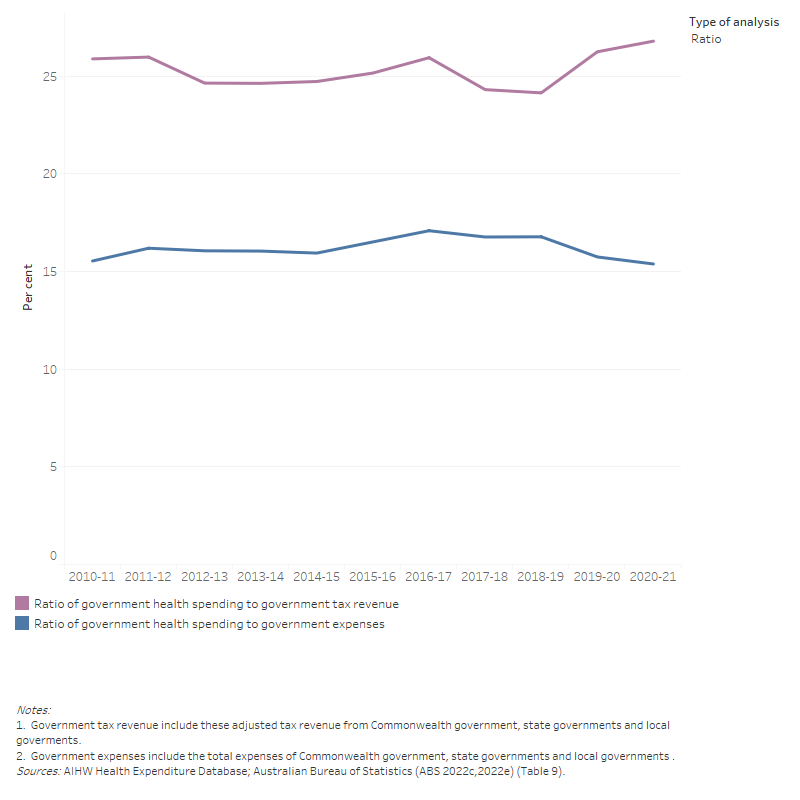
In 2020–21, government health spending was $156.0 billion, which accounted for 15.4% of total government expenses, approximately 0.3 percentage points lower than 2019–20 (Figure 7). This is attributed to total government expenses growing faster than health spending (12.1% compared with 9.5% over 2020–21, in nominal terms). It is also indicative of a rapid increase in government expenses funded by non-tax revenues and other sources (including borrowing).
During 2020–21, spending on health by all governments represented 26.8% of government tax revenue (Figure 7). This figure shows 2 consecutive years of increase in this ratio and put the ratio higher than at any other point since 1995–96, when consistent data became available.
Figure 7: Ratios of government health spending to government expenses and government tax revenue, current prices, 2010–11 to 2020–21
The line graph shows that total government health spending, tax revenue and government expenses increased from 2010–11 to 2020–21. Total government health spending increased from $90.8 billion in 2010–11 to $156.0 billion in 2020–21. Tax revenue was higher than total government health spending and increased from $350.8 billion in 2010–11 to $582.2 billion in 2020–21. During this period, total government health spending to tax revenue ratio ranged from 24.1 per cent to 26.8 per cent. In addition, total government expenses were higher than total government health spending and increased from $584.4 billion in 2010–11 to $1,013 billion in 2020–21. During this period, total government health spending to government expenses ratio ranged from 15.4 per cent to 17.1 per cent.

More details on the Australian Government’s Economic Response to COVID-19 can be found on the Australian Government Department of Treasury website while state and territory government programs can be found in their specific websites. More on the relationship between tax revenue and government expenses can be found in the box below.
Tax revenue and government expenses
Taxation revenue is a major source of income used by governments to fund public services, including health spending. The Australian Government raises revenue through taxing individuals and businesses, including through:
- personal income tax
- goods and services tax (GST), for which all revenue is distributed to states and territories
- company tax.
State and territory governments receive funds from the Australian Government, but also collect taxes, such as stamp duty on the purchase of a house or taxes on payrolls.
It should be noted that tax revenue is only one way that governments fund expenses and that tax rates vary over time and across the population. In that context, the government health spending to tax revenue ratio is only an indirect or crude measure of the amount of government resourcing dedicated to health over the long term. Government expenses can also be funded through borrowing and other forms of revenue generation, such as licence fees, charges for goods and services, fines and return on government’s assets.
Apart from health spending, other purposes of government expenses include:
- social protection
- general public services
- economic affairs
- defence
- education
- public order and safety
- environmental protection
- recreation
- culture and religion
- transport (see ABS 2022c).


