National Drug Strategy Household Survey 2022–2023:
Support for alcohol and other drug-related policies
Web article
Last updated:
Topic: Illicit use of drugs
Citation
AIHW (Australian Institute of Health and Welfare) (2024) Support for alcohol and other drug-related policies, AIHW, Australian Government, accessed 28 July 2026.
This article is part of National Drug Strategy Household Survey 2022–2023
Alcohol consumption
Illicit drugs
Priority population groups
- Alcohol, tobacco and other drug use among people with CALD backgrounds
- Alcohol, tobacco, e‑cigarette and illicit drug use by population groups: Interactive data
- First Nations people’s use of alcohol, tobacco, e-cigarettes and other drugs
- LGBT people’s use of alcohol, tobacco, e-cigarettes and other drugs
- Mental health and use of alcohol, tobacco, e–cigarettes and other drugs
- Older people’s use of alcohol, tobacco, e-cigarettes and other drugs
- Pregnant and breastfeeding women’s use of alcohol and other drugs
- Veterans' use of alcohol, tobacco, e-cigarettes and other drugs
- Young people’s use of alcohol, tobacco, e-cigarettes and other drugs
Geographic areas
Perceptions of drugs and policy support
- Perceptions of alcohol, tobacco and drugs in Australia
- Support for alcohol and other drug-related policies This page
Tobacco and e cigarettes/vapes
How has support for tobacco and e‑cigarette policies changed since 2019?
Tobacco policy support increased slightly
Between 2019 and 2022–2023, the proportion of people in Australia who smoked tobacco daily decreased to a historic low of 8.3%. Over the same period, support increased for some policies aimed at reducing the problems associated with tobacco use, with the biggest increases occurring for policies aimed at premises that sell tobacco and banning additives in cigarettes to make them less attractive to young people (Figure 1). This increase has occurred after a gradual decline in support for tobacco policies between 2007 and 2019.
Figure 1: Tobacco-related policy measures with the largest change in support(a), people aged 14 and over, 2004 to 2022–2023
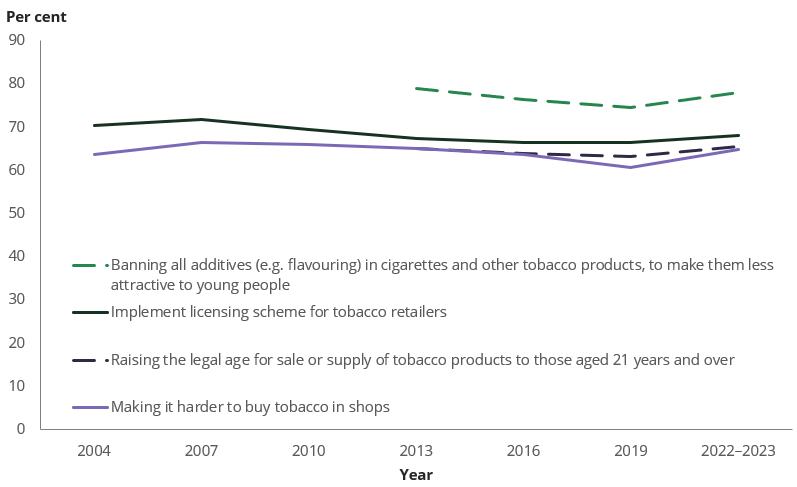
(a) ‘Support’ or ‘Strongly support’.
Note: Policy options for ‘Raising the legal age…’ and ‘Banning all additives…’ were included in the survey from 2013.
Source: NDSHS 2022–2023, Table 2.46.
Policy options related to increasing the tax on tobacco products (whether to pay for health education, treatment costs, or to discourage smoking) remained stable between 2019 and 2022–2023, after decreasing between 2016 and 2019. They were still supported by about two thirds of people in Australia (ranging from 64% to 68%).
Two new tobacco policy measures were asked about in 2022–2023:
- Around 4 in 5 people (81%) supported banning the advertising of tobacco products on social media, making it the most supported policy measure related to tobacco use.
- Just over 1 in 2 people (53%) supported banning the sale of tobacco products in places where people are consuming alcohol, making it the least supported policy measure related to tobacco use.
E‑cigarette policy support increased substantially
E‑cigarette policy in Australia
From early 2024, new regulations on vapes and electronic cigarettes come into effect. These include restrictions on the importation of vapes (including those that do not contain nicotine), except for therapeutic purposes, such as smoking cessation and nicotine dependence (TGA 2023).
The 2022–2023 NDSHS was conducted before these restrictions were put into place. At the time, in most jurisdictions, it was legal for adults to purchase e‑cigarettes that did not contain nicotine without restrictions. Adults could also import nicotine e‑cigarettes with a prescription.
These results reflect the opinions on e‑cigarette policies in Australia prior to the new restrictions coming into effect in 2024.
In contrast to tobacco smoking, the proportion of people who used electronic cigarettes and vapes (e‑cigarettes) increased between 2019 and 2022–2023, particularly among young people. At the same time, support for all policy options related to addressing the problems associated with e‑cigarette use increased substantially (Figure 2).
The increase in policy support aimed at people under the age of 18 was particularly notable. Almost 1 in 10 people (9.7%) aged between 14 and 17 currently used e‑cigarettes in 2022–2023, and the proportion of people in Australia who supported prohibiting the sale of e‑cigarettes (including those without nicotine) to people under the age of 18 increased to a high of 86% in 2022–2023 (Figure 2).
Figure 2: Support(a) for measures targeting problems associated with e‑cigarette use, people aged 14 and over, 2016 to 2022–2023
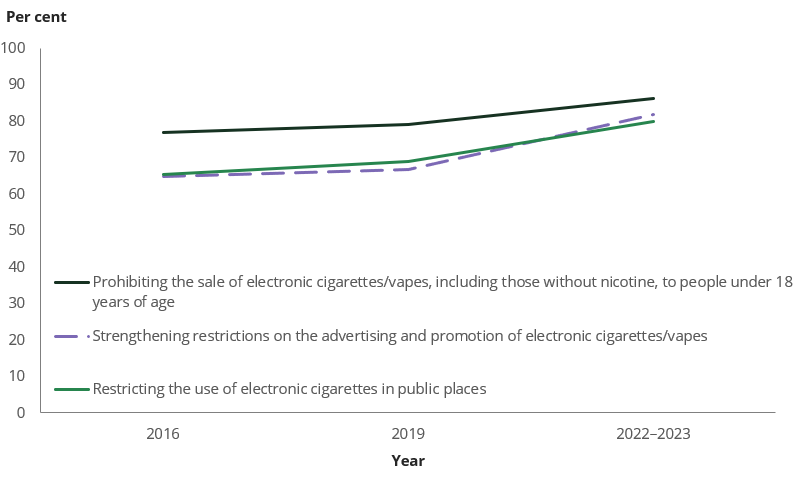
(a) ‘Support’ or ‘Strongly support’.
Source: NDSHS 2022–2023, Table 3.44.
Around 3 in 4 people (78%) supported banning all additives (for example, flavouring) in e‑cigarettes, to make them less attractive to young people. 2022–2023 was the first time this measure was included in the National Drug Strategy Household Survey.
Lower support for alcohol measures, despite increasing community concern
Continuing the trend seen since 2013, support for most policy options related to reducing the problems associated with excessive alcohol consumption decreased between 2019 and 2022–2023. The largest declines occurred in policies aimed at changing late night trading of alcohol and in raising the legal drinking age (Figure 3).
This decline in policy support occurred while there was a relatively stable level of risky alcohol consumption between 2019 and 2022–2023, and increasing community concern about alcohol:
- 39% of people believed that alcohol was responsible for the most deaths in Australia in 2022–2023, up from 34% in 2019.
- 31% of people believed excessive drinking of alcohol was the drug of most serious concern for the community, up from 26% in 2019.
Figure 3: Alcohol-related policy measures with the largest change in support(a), people aged 14 and over, 2004 to 2022–2023
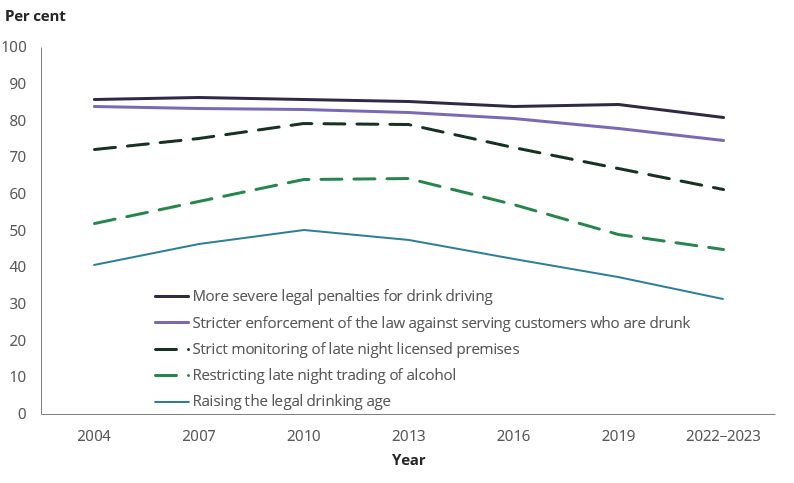
(a) ‘Support’ or ‘Strongly support’.
Source: NDSHS 2022–2023, Table 4.68.
There were two new policy options targeting alcohol consumption introduced in the 2022–2023 National Drug Strategy Household Survey:
- Around 2 in 3 people (67%) supported limiting alcohol advertising online and on social media.
- Only 35% of people supported restrictions on where zero-alcohol products with an alcohol brand can be displayed and sold in stores, but this was still higher than the proportion of people that opposed it (20%). This made it the measure with the highest proportion of people neither supporting nor opposing is (45%).
How has support for drug checking and harm minimisation changed?
Between 2019 and 2022–2023, support for almost all policy measures aimed at reducing drug-related harm increased. As shown in Figure 4, the largest increases occurred for allowing people to test their drugs/pills at designated sites (now supported by almost two thirds of people, 64%), and supervised drug consumption facilities/rooms (now supported by more than half of respondents at 53%).
Figure 4: Support(a) for measures relating to illicit drugs and harm minimisation, people aged 14 and over, 2019 and 2022–2023
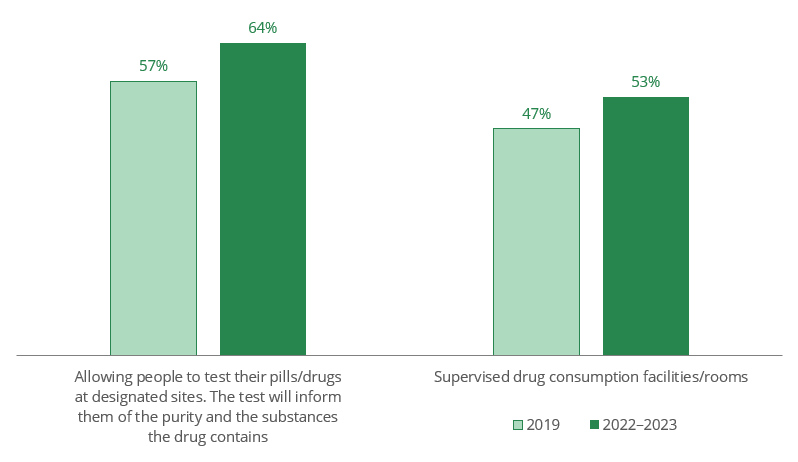
(a) ‘Support’ or ‘Strongly support’.
Source: NDSHS 2022–2023, Table 11.13.
The Australian Government conducted a take home naloxone pilot from 1 December 2019 to 30 June 2021. This pilot provided people who might experience or witness an opioid overdose with free naloxone, a drug that reverses the effects of an overdose. The outcomes of this pilot were positive, and from 1 July 2022 the take home naloxone program was expanded nationally (Department of Health and Aged Care 2023).
Positively, public support for take home naloxone has also increased since 2019, from 56% to 61% in 2022–2023. This was the largest increase in support for injecting drug use-related policies between 2019 and 2022–2023.
Opposition to legalising illicit drugs other than cannabis was high, but decreasing
When asked whether they would support or oppose the personal use of select illicit drugs being made legal, a substantial majority of people opposed legalising all illicit drugs except for marijuana/cannabis. However, there was a decrease in opposition to all illicit drugs being made legal between 2019 and 2022–2023 (Figure 5).
Figure 5: Opposition(a) to personal use of select illicit drugs being made legal, people aged 14 and over, 2004 to 2022–2023
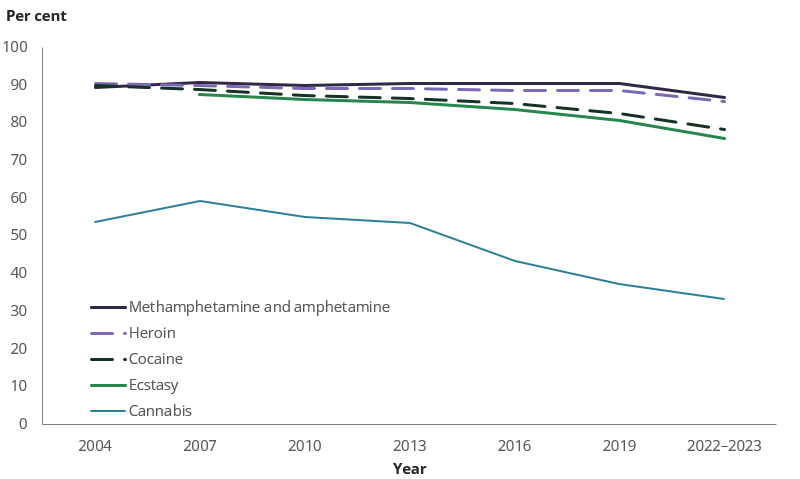
(a) ‘Oppose’ or ‘Strongly oppose’.
Note: Ecstasy was only included in the survey from 2007.
Source: NDSHS 2022–2023, Table 11.26.
Cannabis was the clear exception, with more people supporting legalisation of cannabis for personal use (45%) than opposing it (33%). This was also the first time that more people supported legalising cannabis for personal use than supported increased penalties for the sale or supply of cannabis (39% in 2022–2023), reflecting a continuing trend in public views towards cannabis becoming more positive.
Less support for prison sentences and law enforcement in response to illicit drug use
The National Drug Strategy Household Survey asks people, if they were given $100 to spend on reducing illicit drug use, how much would they allocate to education, treatment, and law enforcement. Results in 2022–2023 continued long-term trends that have occurred since 2004 (Figure 6):
- On average, people said they would give more money to education (increasing from $31 in 2004 to $36.5 in 2022–2023) and treatment (from $25 to $32).
- In contrast, the average hypothetical amount spent on law enforcement has decreased from $44 in 2004 to $31.5 in 2022–2023, making this the first time that the average amounts allocated to treatment and law enforcement were similar (Figure 6).
Figure 6: Average preferred distribution of $100 for reducing illicit drug use, people aged 14 and over, 2004 to 2022–2023
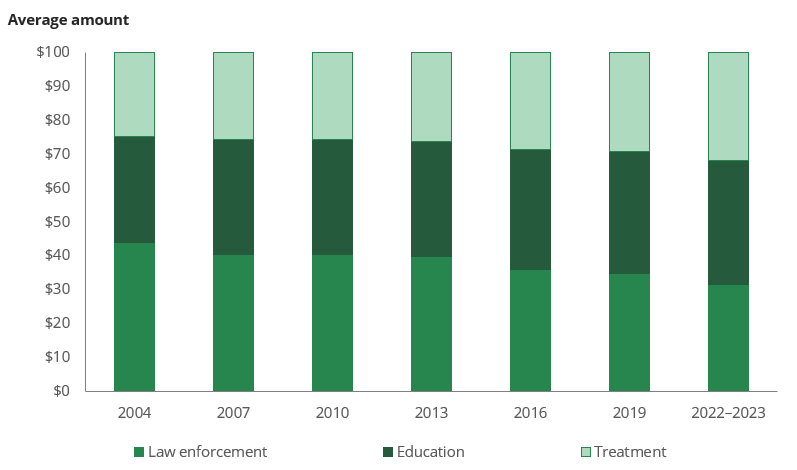
Source: NDSHS 2022–2023, Table 11.33.
This change in allocation of a hypothetical $100 was reflected in the actions that people believed should be taken against people found in possession of illicit drugs for personal use. For all five illicit drugs, there was a decrease in the proportion of people who thought the appropriate action was a prison sentence, and an increase in the proportion of people nominating a caution/warning or no action (Figure 7).
The most commonly selected action for all illicit drugs (excluding cannabis) was referral to a treatment or education program; for cannabis, it was a caution/warning or no action (Figure 7).
Figure 7: Action that should happen to someone found in possession of small quantities of selected illicit drugs, people aged 14 and over, 2022–2023
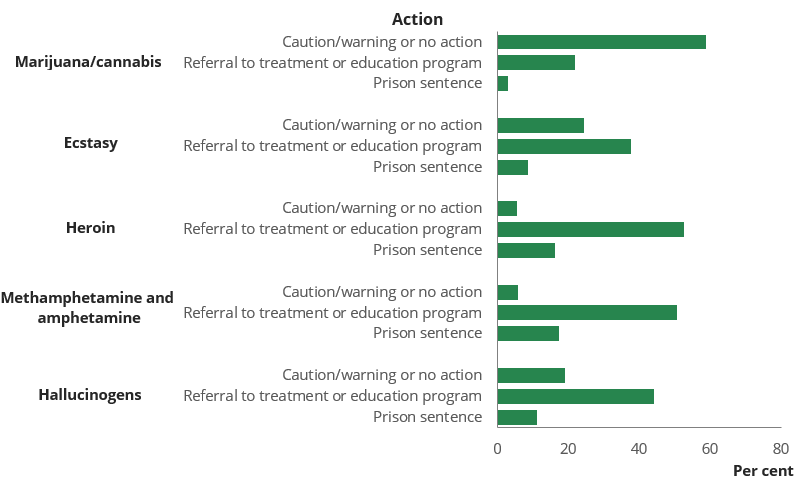
Source: NDSHS 2022–2023, Table 11.32.