National Drug Strategy Household Survey 2022–2023:
Older people’s use of alcohol, tobacco, e-cigarettes and other drugs
Web article
Last updated:
Topic: Older people
Citation
AIHW (Australian Institute of Health and Welfare) (2024) Older people’s use of alcohol, tobacco, e-cigarettes and other drugs, AIHW, Australian Government, accessed 14 July 2026.
This article is part of National Drug Strategy Household Survey 2022–2023
Alcohol consumption
Illicit drugs
Priority population groups
- Alcohol, tobacco and other drug use among people with CALD backgrounds
- Alcohol, tobacco, e‑cigarette and illicit drug use by population groups: Interactive data
- First Nations people’s use of alcohol, tobacco, e-cigarettes and other drugs
- LGBT people’s use of alcohol, tobacco, e-cigarettes and other drugs
- Mental health and use of alcohol, tobacco, e–cigarettes and other drugs
- Older people’s use of alcohol, tobacco, e-cigarettes and other drugs This page
- Pregnant and breastfeeding women’s use of alcohol and other drugs
- Veterans' use of alcohol, tobacco, e-cigarettes and other drugs
- Young people’s use of alcohol, tobacco, e-cigarettes and other drugs
Geographic areas
Perceptions of drugs and policy support
Tobacco and e cigarettes/vapes
Older people (aged 60 and over) in Australia can be more susceptible to alcohol, tobacco and other drug problems as a result of difficulties with pain and medication management, isolation, poor health, significant life events and loss of independent living (Department of Health and Aged Care, 2017). As such, it is important to understand how the use of alcohol, tobacco and other drugs differ between older and younger people, so that the harms and risks that may affect different generations can be understood, and the evidence used to develop targeted policies.
Smoking remains unchanged among people aged 60 and over
While the proportion of people smoking has dropped over the last 12 years for almost all age groups, the proportion of older people who smoke tobacco has remained steady (Figure 1). Between 2010 and 2022–2023, the smoking rate among people in their 60s fell slightly from 12.7% to 10.4%, and for people in their 70s it remained stable (5.6% in 2010 and 4.9% in 2022–2023).
This means that about 500,000 people aged 60 and over smoked tobacco daily in 2022–2023, higher than the 400,000 who did so in 2010. With the reductions in smoking among younger age groups, this means that people who smoke, as a group, tend to be much older than in 2010 on average and therefore may have more complex health needs. In 2022–2023, around 1 in 4 (24.7%) people who smoked daily were 60 or older, compared to around 1 in 7 (13.6%) in 2010.
Figure 1: Daily smoking by age, 2010 to 2022–2023
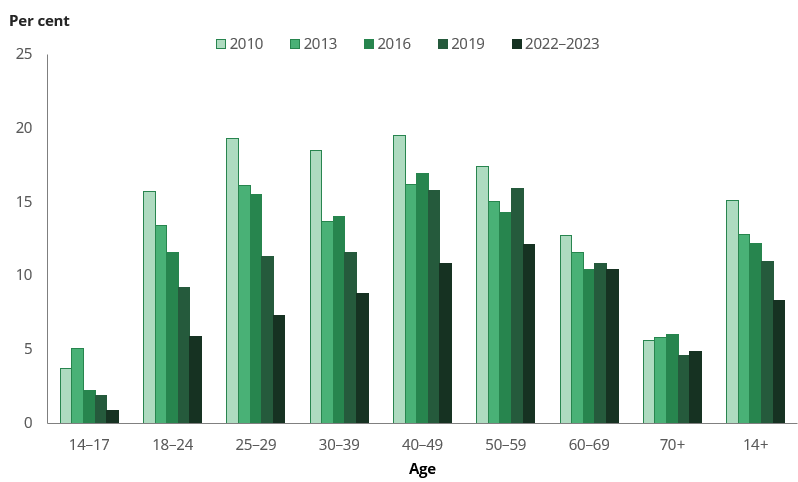
Source: NDSHS 2022–2023, Table 2.4.
Uptake of electronic cigarettes remains low among older people
People aged 60 and over were much less likely to use electronic cigarettes/vapes (‘e cigarettes’) compared with younger age groups. In 2022–2023, 1.6% of people aged 60 to 69 and *0.4% of people aged 70 and over reported currently using e cigarettes, similar proportions to 2019 (1.2% and *0.2%, respectively). In stark contrast, use of e cigarettes increased sharply between 2019 and 2022–2023 for all other age groups (Figure 2).
* Estimate has a relative standard error between 25% and 50% and should be interpreted with caution.
Figure 2: Current use of e‑cigarettes by age, 2016 to 2022–2023
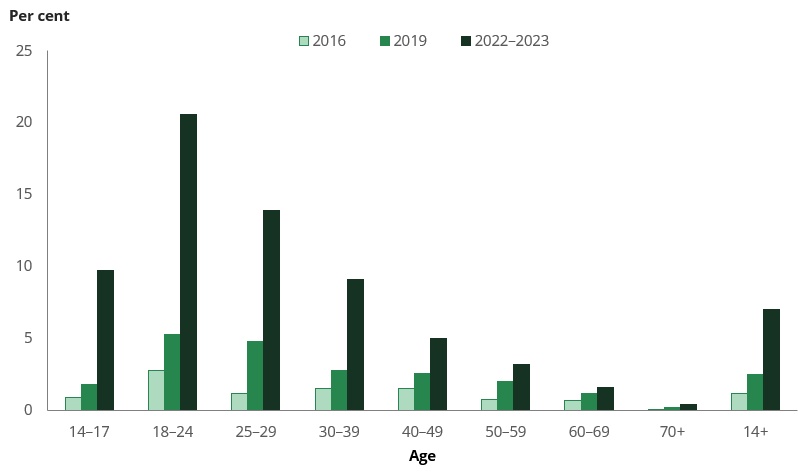
Source: NDSHS 2022–2023, Table 3.9.
While uptake of e cigarettes has remained low among older people, those that did report having tried e cigarettes were much more likely to have done so in relation to their use of combustible tobacco cigarettes than younger people:
- Most older people smoked tobacco when they first used an e cigarette. Around 4 in 5 people aged 60 and over (81%) smoked regular (combustible) tobacco when they first tried an e cigarette, and around 3 in 4 people aged 70 and over (73%) were as well. In contrast, people aged 18–24 were much more likely to have never smoked (58%) when first trying an e cigarette.
- People in their 60s (53%) and older (49%) were most likely to say that the reason they first tried an e cigarette was to help them quit smoking. This is much higher than the proportions of young people aged 18–24 (9.9%).
Risky drinking remains stable
The proportion of people drinking alcohol in ways that put their health at risk (consuming more than 10 standard drinks per week on average, or more than 4 in a single day at least once a month) remained steady among almost all population groups between 2019 and 2022–2023, and older people were no exception.
In 2022–2023, 1 in 3 (33%) people aged 60 to 69 consumed alcohol at risky levels, similar to the proportions of people in their late 20s through to people in their 50s (Figure 3). People aged 70 and over had the second lowest proportion of risky drinking of any age group, at 25%. However, both older age groups remained just as likely to consume alcohol in ways that put their health at risk as 12 years ago, with 33% of people in their 60s and 27% of people in their 70s doing so in 2010.
Figure 3: Risky alcohol consumption by age, 2010 to 2022–2023
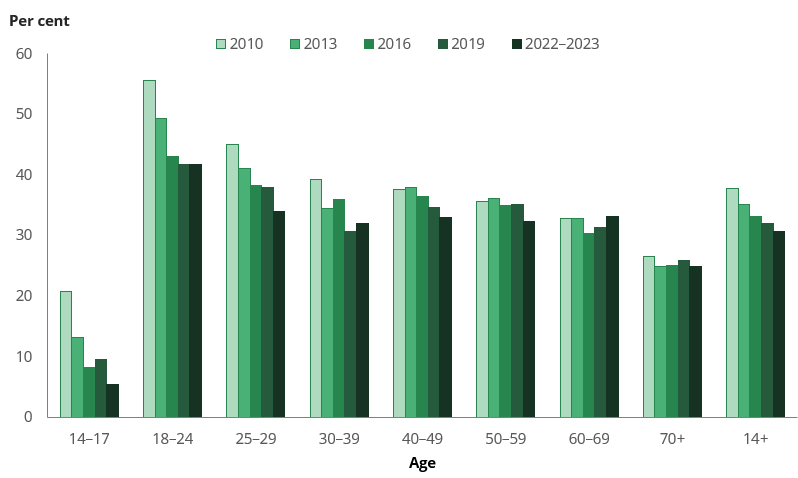
Source: NDSHS 2022–2023, Table 4.28.
People in their 60s and over were much more likely to have exceeded the alcohol guidelines by consuming 10 or more standard drinks a week (30% of people aged 60–69 and 24% of people aged 70 and over) but were less likely to consume more than 4 standard drinks in a single day at least monthly (19.4% and 10.3% respectively). This was in contrast to younger people, such as those aged 18–24, who were most likely to drink at risky levels by consuming more than 4 standard drinks in a single day at least monthly (41% in 2022–2023).
Recent use of illicit drugs lowest among older people, but non‑medical use of pain-relievers high
People aged 60 and over were less likely to have used illicit drugs in the previous 12 months than other age groups. In 2022–2023, 7.8% of people aged 60 and over had recently used illicit drugs, while people aged 20–29 were more than 4 times as likely to have done so (33%). The proportion of older people who had used illicit drugs in the previous 12 months has gradually increased since 2010 when just 5.2% had done so (Figure 4), a trend that was consistent with other age groups.
Figure 4: Recent use of illicit drugs by age, 2010 to 2022–2023
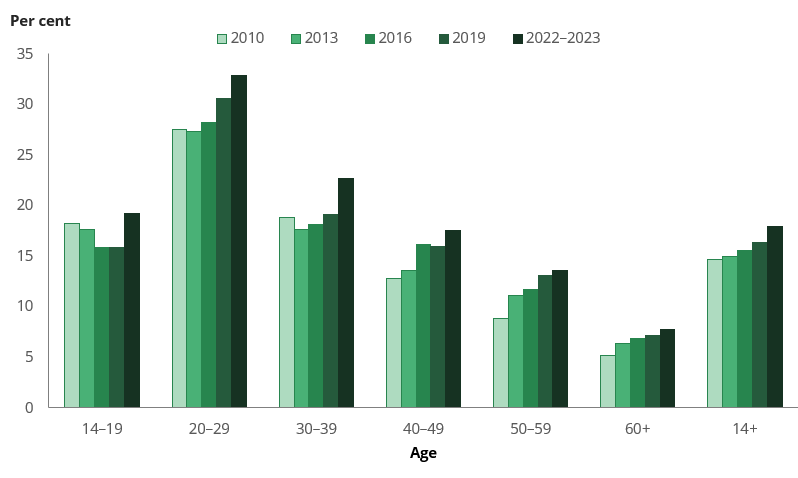
Source: NDSHS 2022–2023, Table 5.8.
In the NDSHS, non‑medical use refers to using a drug for recreational purposes (to induce or enhance a drug experience) and using a drug in a way that it was not prescribed/recommended (for example, using it to enhance a drug experience, for weight loss or performance enhancement).
Older people were less likely to have recently used each individual drug than younger people, and typically it was people in their 20s who were most likely to have used individual illicit drugs. While people in their 60s and older were also less likely to have used pain relievers and opioids for non-medical purposes in the previous 12 months than those in their 20s, they were more likely to have used them in the last month and were much more likely to have used them in the previous week (Table 1).
Use of pain-relievers and opioids | People aged 20–29 | People aged 60+ |
|---|---|---|
In lifetime | 5.9% | 3.6% |
In the previous 12 months | 2.5% | 2.1% |
In the previous month | *0.4% | 0.8% |
In the previous week | *0.2% | 0.5% |
* Estimate has a relative standard error between 25% and 50% and should be interpreted with caution.
Source: NDSHS 2022–2023, Table 6.6.
As a result of higher previous month and previous week use, the harms from drug use among older people are more likely to come from non-medical use of pain relivers and opioids than from illegal drugs such as cocaine and ecstasy.