Prevalence of trachoma
Measure 1.3.1: The estimated number, and proportion of Indigenous children in at-risk communities with active trachoma
Trachoma is an infectious disease of the eye. Repeated trachoma infections can result in scarring, in-turned eye-lashes (trichiasis) and blindness if left untreated. Trachoma is found in some remote areas of Australia. Prevalence data are important for assessing the effectiveness of trachoma control activities.
Figure 1.3.1: Prevalence of trachoma
Figures for measure 1.3.1 presents 2 separate charts showing the prevalence of active trachoma in at-risk Indigenous communities, by various characteristics.
Prevalence of active trachoma in at-risk communities for children aged 5–9 by jurisdiction, 2021
This vertical bar chart compares the proportion of Indigenous children aged 5–9 with active trachoma, by state and territory. The chart shows that, in 2021, the proportion of children aged 5–9 in the screened communities who had active trachoma was 14% in Western Australia (67 children), 6% in the Northern Territory (55 children) and in Queensland no children were found with active trachoma.
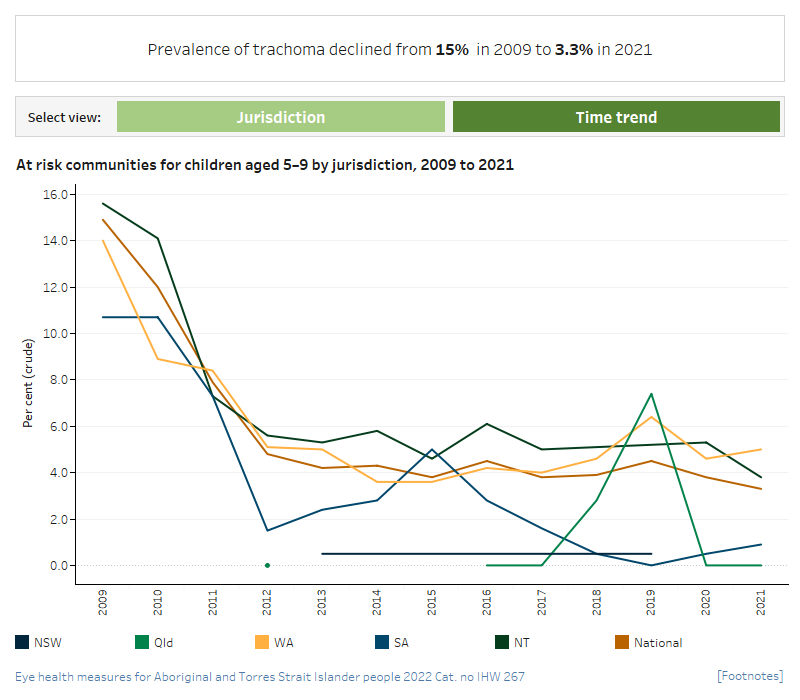
Prevalence of active trachoma in at-risk communities for children aged 5–9 by jurisdiction, 2009 to 2021
This line graph presents changes in the proportion of Indigenous children aged 5–9 with active trachoma from 2009 to 2021 for five jurisdictions and all states combined. The chart shows that, between 2009 and 2021, the estimated prevalence of active trachoma in children aged 5–9 in all at-risk communities fell from 15% to 3.3%.

- From 2009 to 2021, the estimated prevalence of active trachoma in children aged 5–9 screened in all at-risk communities fell from 15% to 3.3%. The estimated prevalence has been below 5% since 2012.
- In 2021, the proportion of children aged 5–9 with active trachoma in screened communities was 14% in Western Australian (67 children), 6% in the Northern Territory (55 children) and 1.9% in South Australia (7 children). In Queensland, no children were found with active trachoma.


