Differences by sex and age groups


Overview
Different groups of the population experience differing rates of injury by cause and type of injury. Age can affect injury risk factors, in part due to the life-stages a person goes through, including their physical development, health status, socioeconomic area, lifestyle, and activities a person is involved in (Chau et al 2009). While males contribute to most cases of injury across most causes, older people (particularly females) and young children are more prone to falls. This chapter details how causes of injury differ by age and sex.
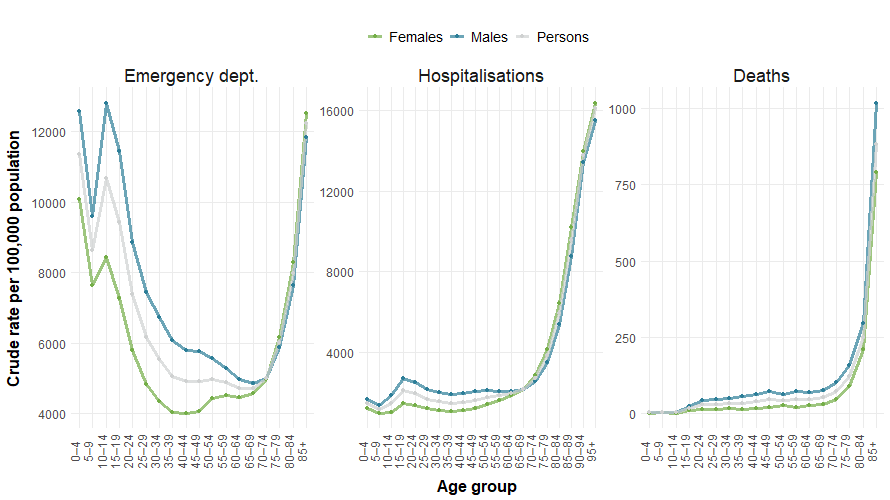
Overall, males had higher rates of injury-related ED presentations, hospitalisations, and deaths than females (Figure 16). For example:
- Young males were more likely than females to present to ED and be hospitalised, however this difference narrowed among those aged 65 and above.
- From about age 10 onward, males consistently had higher injury-related death rates across all age groups. Female injury rates approached those of males later in life – around age 70 for ED visits, 65 for hospitalisations, and 80 for deaths.
- Injury rates were high among older adults and children, with ED presentations notably elevated among children under 14 before declining during adolescence.
Figure 16: ED presentations, hospitalisations (2024–25), and deaths (2023–24) for injury, by 5-year age group
Notes:
- Person totals include hospitalisations where the sex of the patient was other, inadequately described or not stated.
- Crude rates per 100,000 population.
Sources: AIHW National Hospital Morbidity Database, AIHW National Mortality Database, AIHW National Non-admitted Patient Emergency Department Care Database, and ABS National, state and territory population.