Falls
This section presents information on deaths that occurred as a result of an Unintentional fall injury. NMD records that included the following ICD-10 codes were included in this section:
- the UCoD was an Unintentional fall (W00–W19); or
- the UCoD was coded as Exposure to unspecified factor (X59) and the MCoDs included a code for Fracture; or
- the MCoDs included codes for Unintentional fall (W00–W19) and for Injury (S00–T75 or T79); or
- MCoDs included codes for Exposure to unspecified factor (X59) and for Fracture.
The codes for fractures are S02, S12, S22, S32, S42, S52, S62, S72, S82, S92, T02, T08, T10, T12 and T14.2.
These criteria are the same as in previous AIHW reports (AIHW: Henley & Harrison 2015, 2018). Deaths with UCoD X59 and a fracture code as MCoD have been included routinely when reporting fall injury mortality, because of indications that most involve falls (Kreisfeld & Harrison 2005). It is possible that some of the deaths included using the X59 code in combination with a fracture code may not be fall-related. However, the inclusion of these 2 criteria provide a more accurate estimate of fall injury deaths than if they were excluded. For further background, see the sections on falls in previous reports (AIHW: Harrison & Henley 2015; AIHW: Henley & Harrison 2015, 2018).
Suicide and Homicide deaths (UCoD X60–Y09) were excluded.
SES by sex and age
Unlike other external causes of injury examined in this report, rates of Unintentional fall injury deaths in 2015–16 were similar across all socioeconomic groups overall, and for males and females separately (Table 2.5). In nearly all cases, rates for individual socioeconomic groups varied by only 10% or less from the overall rate for both males and females. Rates for males were slightly higher than rates for females across all 5 socioeconomic groups.
|
|
Socioeconomic status of area of usual residence | |||||
|---|---|---|---|---|---|---|
| 1 – lowest | 2 | 3 | 4 | 5 – highest | Total(a) | |
| Males | ||||||
| Deaths | 405 | 487 | 439 | 344 | 353 | 2,034 |
| Deaths per 100,000(b) | 14.5 | 17.4 | 17.5 | 15.2 | 15.6 | 16.1 |
| Rate ratio (c) | 0.9 | 1.1 | 1.1 | 0.9 | 1.0 | |
| Females | ||||||
| Deaths |
572 |
672 |
558 | 482 | 488 | 2,776 |
| Deaths per 100,000(b) | 13.7 | 16.5 | 15.2 | 14.0 | 14.0 | 14.8 |
| Rate ratio(c) | 0.9 | 1.1 | 1.0 | 0.9 | 0.9 | |
| Persons | ||||||
| Deaths |
977 |
1,159 |
997 | 826 | 841 | 4,810 |
| Deaths per 100,000(b) | 14.2 | 17.0 | 16.3 | 14.6 | 14.7 | 15.4 |
| Rate ratio(c) | 0.9 | 1.1 | 1.1 | 0.9 | 1.0 | |
Notes:
- ‘Total’ includes cases for which the socioeconomic group was not able to be determined.
- Rates are directly age-standardised using populations by socioeconomic status groups, which do not include persons in areas for which the socioeconomic status could not be determined. Therefore, the total standardised rates for analyses by socioeconomic status group differ from rates calculated by state or territory.
- Rate ratio = rate for each individual socioeconomic group/total rate.
Figure 2.13 shows the proportion of Unintentional fall injury deaths in each socioeconomic group for males and for females. As with rates (see Table 2.5), there was very little difference between males and females in terms of their respective socioeconomic profiles. The proportion of deaths was slightly higher in the more disadvantaged socioeconomic groups, but evidence of an association between the proportions of deaths and SES was not strong.
Figure 2.13: Proportion of Unintentional fall injury deaths, by socioeconomic group, by sex, Australia, 2015–16
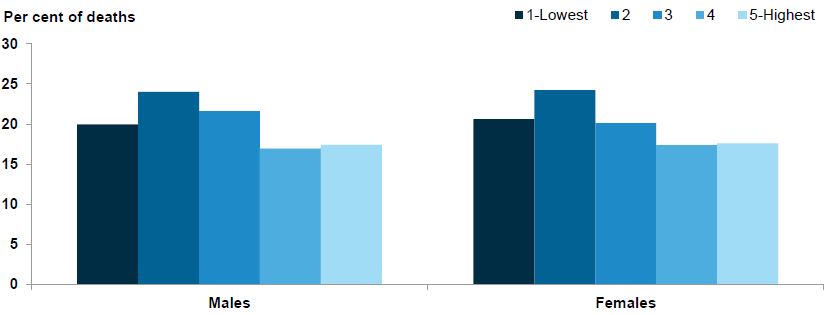
Note: Data underpinning this figure can be found in Table S13 in the supplementary tables spreadsheet.
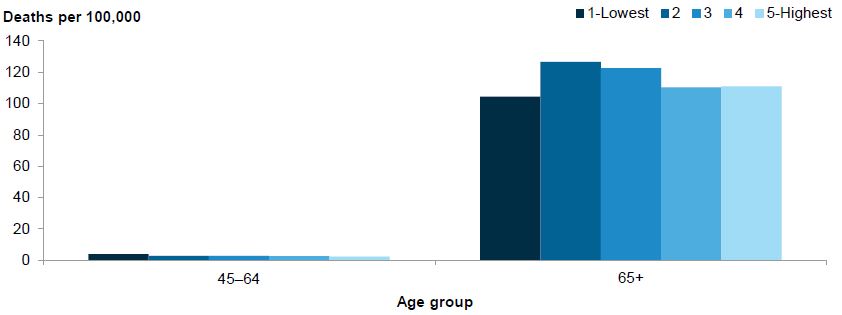
Figure 2.14 shows the age-specific rates of Unintentional fall injury deaths, by socioeconomic group. Almost 95% of unintentional fall injury deaths occurred in those aged 65 and over and a further 4% of deaths in those aged 45–64. Rates for those aged 65 and over were broadly similar across all socioeconomic groups, ranging from 105 deaths per 100,000 population for those from the lowest (most disadvantaged) socioeconomic group to 127 deaths per 100,000 population for those from the second most disadvantaged socioeconomic group. Age-specific rates for age groups younger than 45 are not presented, due to low case counts.
Figure 2.14: Age-specific rates of Unintentional fall injury deaths, by age group, by socioeconomic group, Australia, 2015–16
Notes:
- Rates are directly age-standardised using populations by socioeconomic status groups, which do not include persons in areas for which the socioeconomic status could not be determined. Therefore, the total standardised rates for analyses by socioeconomic status group differ from rates calculated by state or territory.
- Data underpinning this figure can be found in Table S14 in the supplementary tables spreadsheet.
Figure 2.15 shows the proportion of Unintentional fall injury deaths in each socioeconomic group, by age group. For those aged 45–64, the proportion of deaths declined steadily with increasing socioeconomic advantage. For those aged 65 and over, the proportion of deaths was moderately higher among those in more disadvantaged socioeconomic groups. The outcomes shown for the 45–64 age group should be treated with caution, due to relatively low case numbers. Results were not shown for the 4 youngest age groups due to low case numbers.
Figure 2.15: Proportion of Unintentional fall injury deaths, by socioeconomic group, by age group, Australia, 2015–16
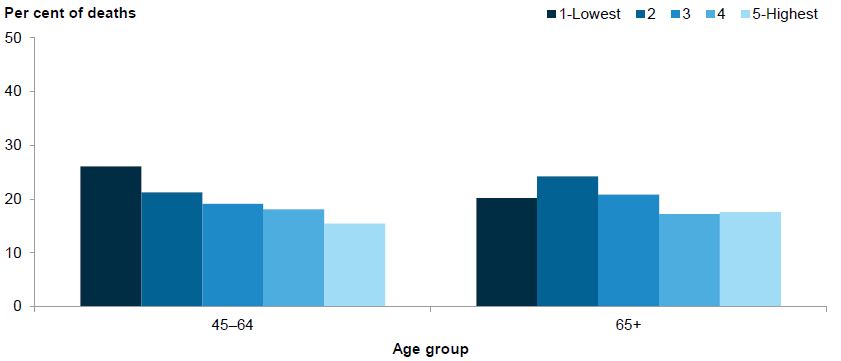
Note: Data underpinning this figure can be found in Table S15 in the supplementary tables spreadsheet.