Unintentional poisoning
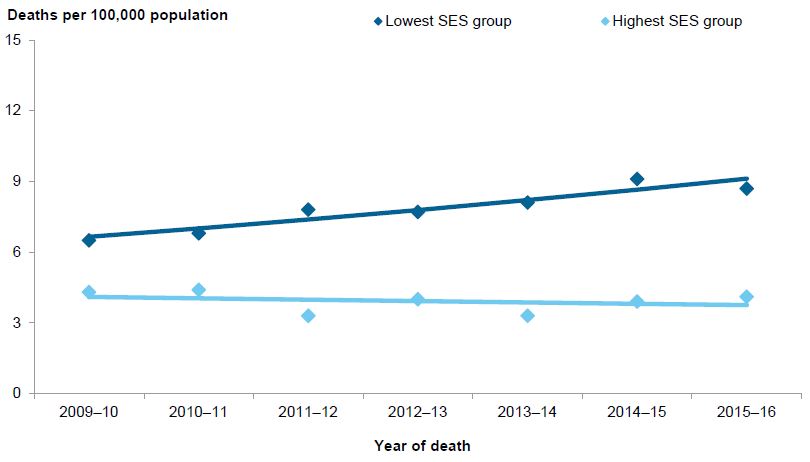
An analysis of changes over time for the lowest (most disadvantaged) and highest (least disadvantaged) socioeconomic groups for Unintentional poisoning deaths is shown in Figure 3.7. Over the period from 2009–10 to 2015–16, rates of unintentional poisoning deaths in the lowest (most disadvantaged) group ranged from 1.5 to 2.5 times as high, annually, as rates in the highest (least disadvantaged) group.
Rates of Unintentional poisoning deaths increased over time for the lowest (most disadvantaged) socioeconomic group, in contrast with the highest (least disadvantaged) socioeconomic group, for which rates decreased over time. For the lowest (most disadvantaged) group, rates of Unintentional poisoning deaths increased from 6.5 to 8.7 deaths per 100,000 between 2009–10 and 2015–16. The rise in the modelled rate averaged 5.4% per year and was statistically significant. For the highest (least disadvantaged) group, rates of deaths decreased from 4.3 to 4.1 deaths per 100,000 between 2009–10 and 2015–16. The drop in the modelled rate averaged 1.5% per year, but was not statistically significant.
Figure 3.7: Modelled age-standardised rates of Unintentional poisoning deaths, by lowest and highest socioeconomic groups, Australia, 2009–10 to 2015–16
Notes
- The solid lines represent the modelled rates from 2009–10 to 2015–16. The filled symbols represent the observed age-standardised rate value for each year.
- Data underpinning this figure can be found in Table S31 in the supplementary tables spreadsheet.
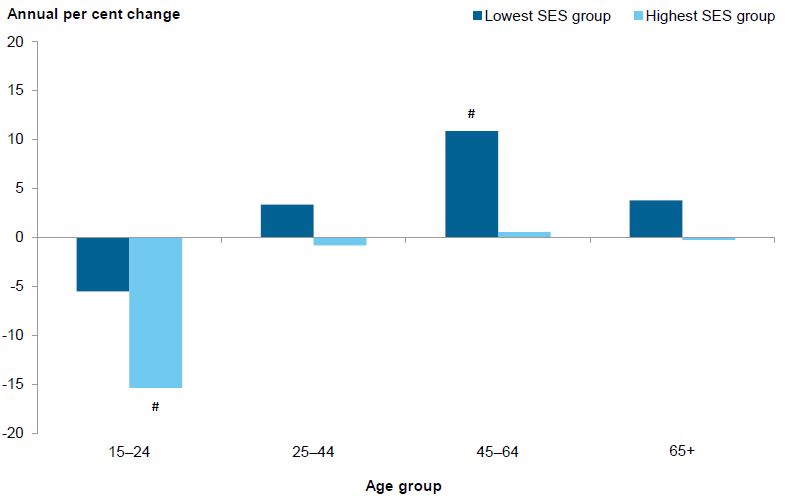
An analysis of Unintentional poisoning death rates, by age group, over the 7-year period reveals variation by age in both the lowest (most disadvantaged) and highest (least disadvantaged) socioeconomic groups. Figure 3.8 shows the annual percentage change in rate of injury deaths for 6 age groups within these 2 socioeconomic groups.
For those in the lowest (most disadvantaged) socioeconomic group, rates of Unintentional poisoning deaths increased in the 3 oldest age groups over the period from 2009–10 to 2015–16. The largest average annual increase in this socioeconomic group was for those aged 45–64 (10.9%). This was the only age group for which the average annual change in rates was statistically significant.
For those in the highest (least disadvantaged) socioeconomic group, rates of Unintentional poisoning deaths decreased over the period by an annual average of 15.4% for those aged 15–24. This average annual change in rates was statistically significant. Changes in average annual rates for other age groups were small and not statistically significant.
Results for children aged 0–14 were not shown for either of the socioeconomic groups, due to low case counts.
Figure 3.8: Average annual percentage change in rate of Unintentional poisoning injury deaths, by lowest and highest socioeconomic groups, by age group, Australia, 2009–10 to 2015–16
Notes
- Age-specific rates are standardised using populations by socioeconomic status groups, which do not include persons in areas for which the socioeconomic status could not be determined.
- As indicated by the (#) symbol, the average annual change in rates of unintentional poisoning injury deaths was statistically significant (p < 0.05) in those aged 15–24 in the highest socioeconomic group and those aged 45–64 in the lowest socioeconomic group.
- Data underpinning this figure can be found in Table S32 in the supplementary tables spreadsheet.