Thermal injury
This section presents information on deaths that occurred as a result Unintentional thermal injury (mainly exposure to smoke and fire or burn injuries). NMD records that included the following ICD-10 codes were included in this section:
- the UCoD was coded as Exposure to smoke, fire and flames or Contact with heat and hot substances (X00–X19); or
- the MCoDs included codes for Exposure to smoke, fire and flames or Contact with heat and hot substances (X00–X19) and for Injury (S00–T75 or T79); or
- the MCoDs included codes for Burns (T20–T31) and for External causes of unintentional injury (V01–X59).
Suicide and Homicide deaths (UCoD X60–Y09) were excluded.
SES by sex and age
In 2015–16, rates of Unintentional thermal injury deaths did not show a strong association with socioeconomic status (Table 2.6). Rates were similar for all but the least disadvantaged socioeconomic group. Rates for males tended to decline with increasing socioeconomic advantage, although this association was not strong. The highest rates were for those from the second most disadvantaged socioeconomic group (0.8 deaths per 100,000 population). Low case numbers for females did not allow for any meaningful interpretation of an association between rates and SES.
|
|
Socioeconomic status of area of usual residence | |||||
|---|---|---|---|---|---|---|
| 1 – lowest | 2 | 3 | 4 | 5 – highest | Total(a) | |
| Males | ||||||
| Deaths | 15 | 22 | 13 | 11< | 6< | 67 |
| Deaths per 100,000(b) | 0.5 | 0.8 | 0.6 | 0.5 | 0.3 | 0.5 |
| Rate ratio | 1.0 | 1.6 | 1.2 | 1.0 | 0.6 | |
| Females | ||||||
| Deaths |
6 |
8 |
5 | 9 | 4 | 33 |
| Deaths per 100,000(b) | 0.2 | 0.2 | 0.2 | 0.2 | 0.2 | 0.2 |
| Rate ratio | 1.0 | 1.0 | 1.0 | 1.0 | 1.0 | |
| Persons | ||||||
| Deaths |
21 |
30 |
18 | 10 | 10 | 100 |
| Deaths per 100,000(b) | 0.4 | 0.5 | 0.4 | 0.2 | 0.2 | 0.4 |
| Rate ratio | 1.0 | 1.3 | 1.0 | 0.5 | 0.5 | |
Notes
- ‘Total’ includes cases for which the socioeconomic group was not able to be determined.
- Rates are directly age-standardised using populations by socioeconomic status groups, which do not include persons in areas for which the socioeconomic status could not be determined. Therefore, the total standardised rates for analyses by socioeconomic status group differ from rates calculated by state or territory.
Figure 2.16 shows the proportion of Unintentional thermal injury deaths in each socioeconomic group, for males and for females. Patterns observed were similar to those for rates (see Table 2.6). For males, the proportions of deaths declined markedly with increasing socioeconomic advantage between the second most disadvantaged socioeconomic group and the highest (least disadvantaged) socioeconomic group. (This result should be treated with caution, due to relatively low case numbers.) Low case numbers for females did not allow for any meaningful interpretation of an association between SES and the proportions of deaths within each socioeconomic profile.
Figure 2.16: Proportion of Unintentional thermal injury deaths, by socioeconomic group, by sex, Australia, 2015–16
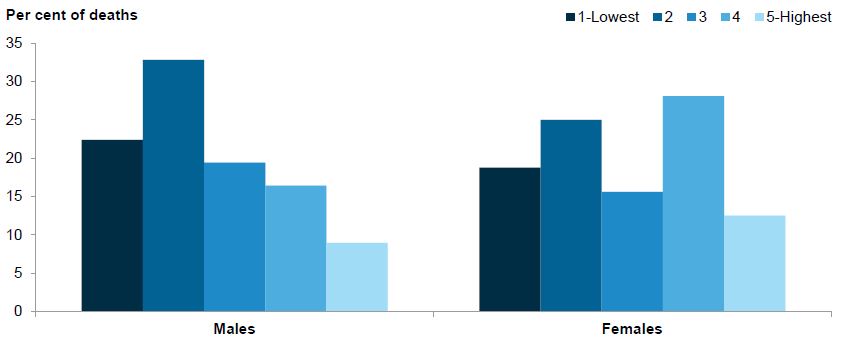
Note: Data underpinning this figure can be found in Table S16 in the supplementary tables spreadsheet.
Figure 2.17 shows the age-specific rates of Unintentional thermal injury deaths, by socioeconomic group. For those aged 45–64 and 65 and over, rates were higher in the 2 most disadvantaged socioeconomic groups. Rates were not shown for those aged 44 and younger, due to low case numbers.
Figure 2.17: Age-specific rates of Unintentional thermal injury deaths, by age group, by socioeconomic group, Australia, 2015–16
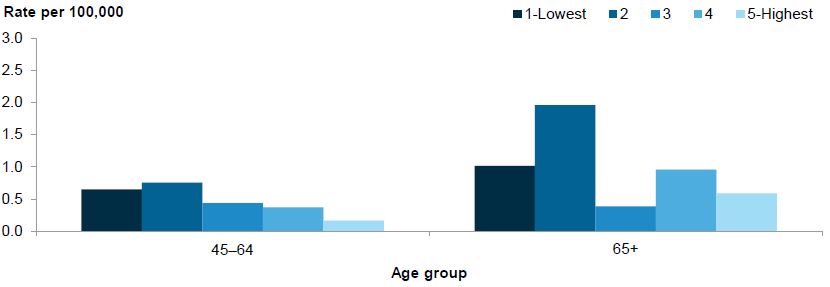
Notes
- Rates are directly age-standardised using populations by socioeconomic status groups, which do not include persons in areas for which the socioeconomic status could not be determined. Therefore, the total standardised rates for analyses by socioeconomic status group differ from rates calculated by state or territory.
- Data underpinning this figure can be found in Table S17 in the supplementary tables spreadsheet.
Figure 2.18 shows the proportion of Unintentional thermal injury deaths in each socioeconomic group, by age group. For those aged 45–64 and 65 and over, the highest proportions of deaths were observed in the 2 most disadvantaged socioeconomic groups. As for rates, proportions of deaths were not shown for those aged 44 and younger, due to low case numbers.
Figure 2.18: Proportion of Unintentional thermal injury deaths, by socioeconomic group, by age group, Australia, 2015–16
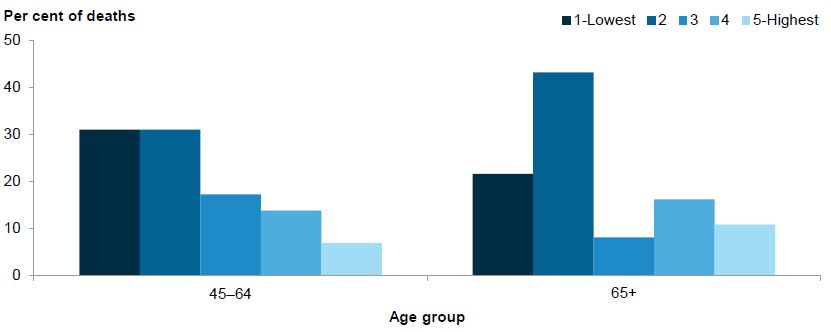
Note: Data underpinning this figure can be found in Table S18 in the supplementary tables spreadsheet.