Falls
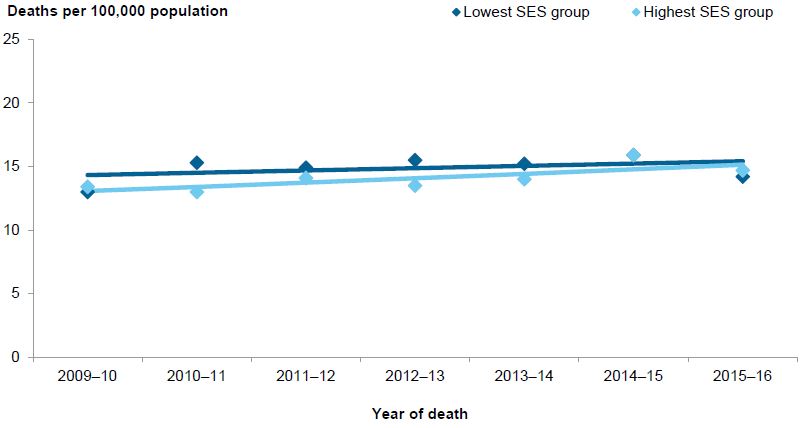
An analysis of the changes over time for the lowest (most disadvantaged) and highest (least disadvantaged) socioeconomic groups for Unintentional fall injury deaths is shown in Figure 3.9. Unlike the previous external causes of injury categories examined, the rates of fall injury deaths were similar between the lowest (most disadvantaged) and highest (least disadvantaged) groups for the whole period.
Rates of Unintentional fall injury deaths increased over time for both the lowest and highest socioeconomic groups. For the lowest (most disadvantaged) group, rates increased from 13.0 to 14.2 deaths per 100,000 between 2009–10 and 2015–16. However, the rise in the modelled rate was not statistically significant. For the highest (least disadvantaged) group, rates increased from 13.4 to 14.7 per 100,000 between 2009–10 and 2015–16. The rise in the modelled rate averaged 2.5% per year and was statistically significant.
Figure 3.9: Modelled age-standardised rates of Unintentional fall injury deaths, by lowest and highest socioeconomic groups, Australia, 2007–08 to 2015–16
Notes
- The solid lines represent the modelled rates from 2009–10 to 2015–16. The filled symbols represent the observed age-standardised rate value for each year.
- Data underpinning this figure can be found in Table S33 in the supplementary tables spreadsheet.
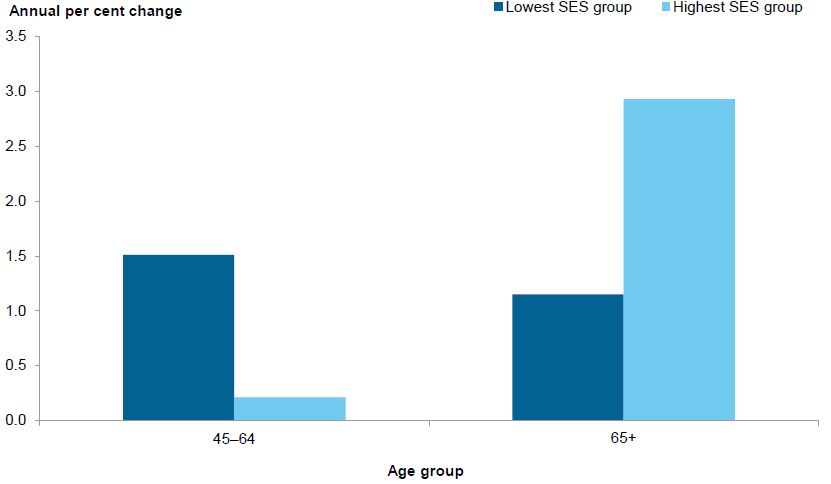
An analysis of Unintentional fall injury death rates over the 7-year period, by age group, reveals variation by age for both the lowest and highest socioeconomic groups. Figure 3.10 shows the annual percentage change in rate of injury deaths for 2 age groups for these 2 socioeconomic groups.
Over the period from 2009–10 to 2015–16, rates of Unintentional fall injury deaths increased for the 45–64 and 65 and over age groups in the lowest (most disadvantaged) socioeconomic group. The largest average annual increase in this socioeconomic group (1.5%) was for those aged 45–64. However, the average annual change in rates was not statistically significant for either of the age groups.
For those aged 65 and over in the highest (least disadvantaged) socioeconomic group, rates of Unintentional fall injury deaths increased over the period of interest by an annual average of 2.9%. As with the most disadvantaged group, the average annual change in rates was not statistically significant for either of the age groups shown.
Results for children aged 0–14 and for those aged 15–24 and 25–44 were not shown for either of the socioeconomic groups, due to low case counts.
Figure 3.10: Average annual percentage change in rate of Unintentional fall injury deaths, by lowest and highest socioeconomic groups, by age group, Australia, 2009–10 to 2015–16
Notes
- Age-specific rates are standardised using populations by socioeconomic status groups, which do not include persons in areas for which the socioeconomic status could not be determined.
- The average annual change in rates of unintentional fall injury deaths was not statistically significant (p < 0.05) in any of the age groups shown for either the lowest or highest socioeconomic group.
- Data underpinning this figure can be found in Table S34 in the supplementary tables spreadsheet.