Transport crash injury
This section presents information on deaths that occurred as a result of an unintentional Transport crash injury. NMD records that included the following ICD-10 codes were included in this section:
- the UCoD was Transport accident (V01–V99); or
- the MCoD included codes for Transport accident (V01–V99) and for Injury (S00–T75 or T79).
Suicide and Homicide deaths (UCoD X60–Y09) were excluded.
SES by sex and age
In 2015–16, rates for Transport crash injury deaths overall, and for both males and females separately, were highest in the 2 most disadvantaged socioeconomic groups and declined with socioeconomic advantage. Rates in the 2 most disadvantaged socioeconomic groups were more than 2 times as high as the rate for the highest (least disadvantaged) socioeconomic group. Rates for males were consistently around 3 times as high as rates for females.
| Socioeconomic status of area of usual residence | ||||||
|---|---|---|---|---|---|---|
|
1—lowest |
2 | 3 | 4 | 5-highest | Total(a) | |
|
Males |
||||||
| Deaths |
277 |
293 |
227 |
176 |
117 |
1,108 |
| Deaths per 100,000(b) | 11.4 | 12.2 | 9.4 | 7.4 | 5.0 | 9.2 |
| Rate ratio (c) | 1.2 | 1.3 | 1.0 | 0.8 | 0.5 | |
| Females | ||||||
| Deaths |
89 |
100 |
80 | 60 | 49 | 388 |
| Deaths per 100,000(b) | 3.5 | 3.9 | 3.1 | 2.3 | 1.8 | 3.0 |
| Rate ratio(c) | 1.2 | 1.3 | 1.0 | 0.8 | 0.6 | |
| Persons | ||||||
| Deaths |
366 |
393 |
307 | 236 | 166 | 1,496 |
| Deaths per 100,000(b) | 7.4 | 8.0 | 6.2 | 4.8 | 3.4 | 6.0 |
| Rate ratio(c) | 1.2 | 1.3 | 1.0 | 0.8 | 0.6 | |
Notes
- ‘Total’ includes cases for which the socioeconomic group was not able to be determined.
- Rates are directly age-standardised using populations by socioeconomic status groups, which do not include persons in areas for which the socioeconomic status could not be determined. Therefore, the total standardised rates for analyses by socioeconomic status group differ from rates calculated by state or territory.
- Rate ratio = rate for each individual socioeconomic group/total rate.
Figure 2.4 shows the proportion of Transport crash injury deaths in each socioeconomic group for males and for females. Similar patterns were observed as for rates (see Table 2.2). For both males and females, the proportion of deaths was highest in the second most disadvantaged group and declined as socioeconomic advantage increased. For both sexes, the proportion of deaths in the lowest (most disadvantaged) group was lower that for the second most disadvantaged group.
Figure 2.4: Proportion of Transport crash injury deaths, by socioeconomic group, by sex, Australia, 2015–16
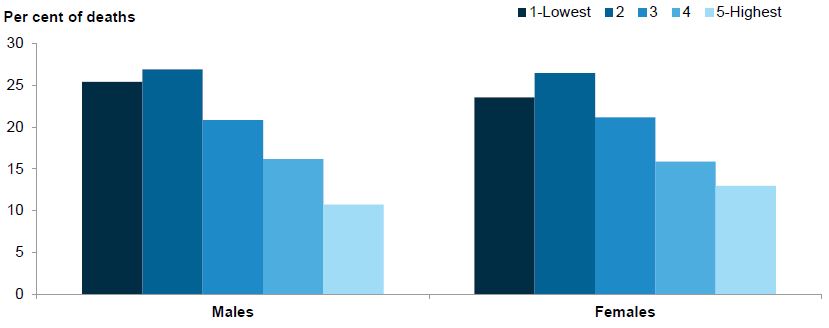
Note: Data underpinning this figure can be found in Table S4 in the supplementary table spreadsheet.
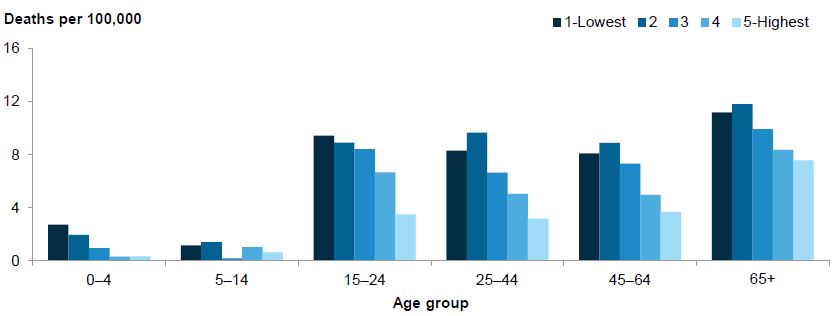
Figure 2.5 shows the age-specific rates of Transport crash injury deaths by socioeconomic group. Generally, there was a strong association between SES and mortality rates within each socioeconomic group, though the 15–24 age group was the only one for which rates declined steadily with increasing socioeconomic advantage across all 5 socioeconomic groups. For the 3 oldest age groups, rates declined sharply with increasing socioeconomic advantage between the second most disadvantaged group and the highest (least disadvantaged) socioeconomic group. For all 3 of these age groups, the second highest rates were observed for the lowest (most disadvantaged) socioeconomic group. Rates for people aged 65 and over were moderately higher across all socioeconomic groups, when compared with the preceding 3 age groups. The change in rates across socioeconomic groups was less pronounced, although still evident for children aged 0–4, while for children aged 5–14, no clear trend was observed.
Figure 2.5: Age-specific rates for Transport crash injury deaths, by age group, by socioeconomic group, Australia, 2015–16
Notes
- Rates are directly age-standardised using populations by socioeconomic status groups, which do not include persons in areas for which the socioeconomic status could not be determined. Therefore, the total standardised rates for analyses by socioeconomic status group differ from rates calculated by state or territory.
- Data underpinning this figure can be found in Table S5 in the supplementary table spreadsheet.
Figure 2.6 shows the proportion of Transport crash injury deaths in each socioeconomic group, by age group. For the 4 oldest age groups, the proportion of deaths in each socioeconomic group generally declined steadily with socioeconomic advantage, although for the oldest 3 of these age groups, the second most disadvantaged socioeconomic group recorded the highest proportion of deaths. Different patterns were observed for the 2 youngest age groups. For children aged 0–4, 45% and 30% of deaths occurred in the lowest (most disadvantaged) and second most disadvantaged socioeconomic groups, respectively, while for children aged 5–14, a combined proportion of 58% of deaths occurred in the 2 most disadvantaged socioeconomic groups. (These results should be treated with some caution, due to the relatively low case numbers for these 2 age groups.)
Figure 2.6: Proportion of Transport crash injury deaths, by socioeconomic group, by age group, Australia, 2015–16
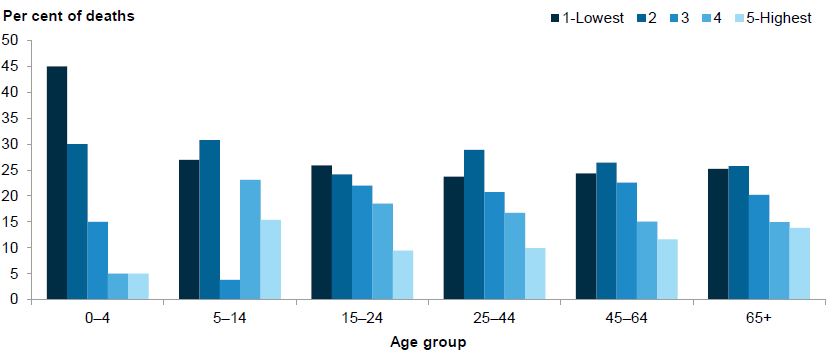
Note: Data underpinning this figure can be found in Table S6 in the supplementary table spreadsheet.